

Figure 1
Figure 1 displays the STL files (top row) for two of the 3-D shapes used in the validation study above the image of the printed shape (bottom row). The shapes used for the sample and Same Trials are denoted with an “S” and the mirror reversed shapes used for Different Trials are denoted with a “D”.
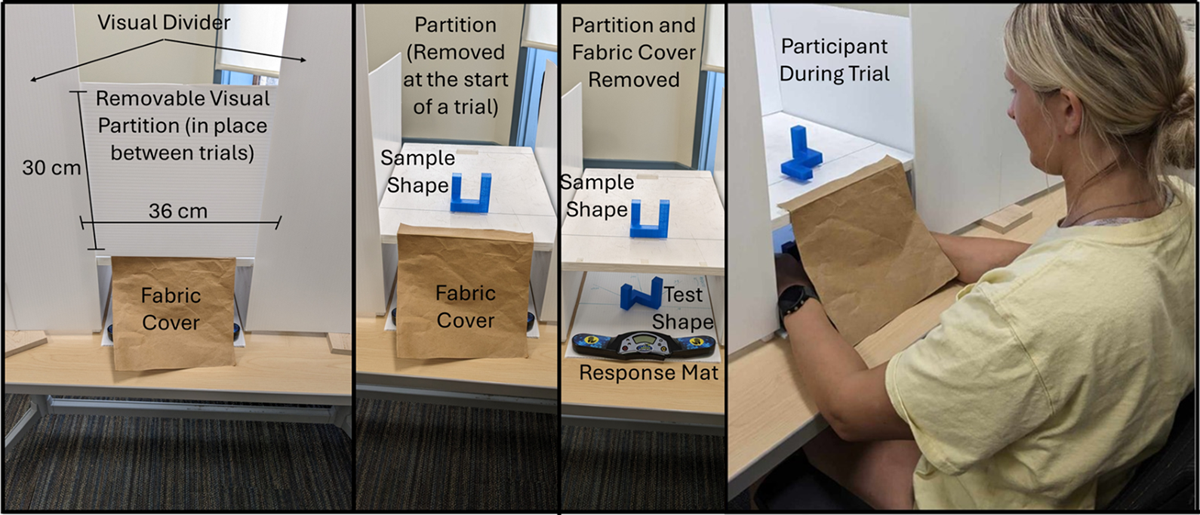
Figure 2
The three left panels of Figure 2 display the apparatus setup at various stages of a trial with some components labeled and/or removed for clarity. The right panel displays a participant during a trial.
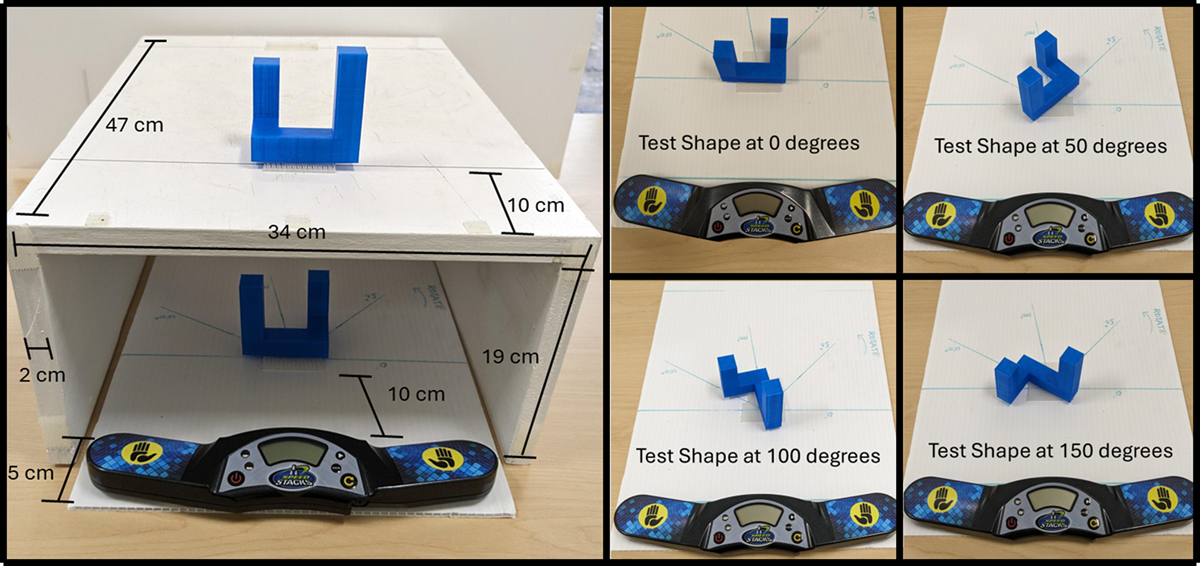
Figure 3
The left panel of Figure 3 displays the apparatus dimensions and the trial set up for Shape 7 on a Different Trial with the test shape rotated to 0°. The right panel displays Shape 7 at each of the 4 angles of rotation.
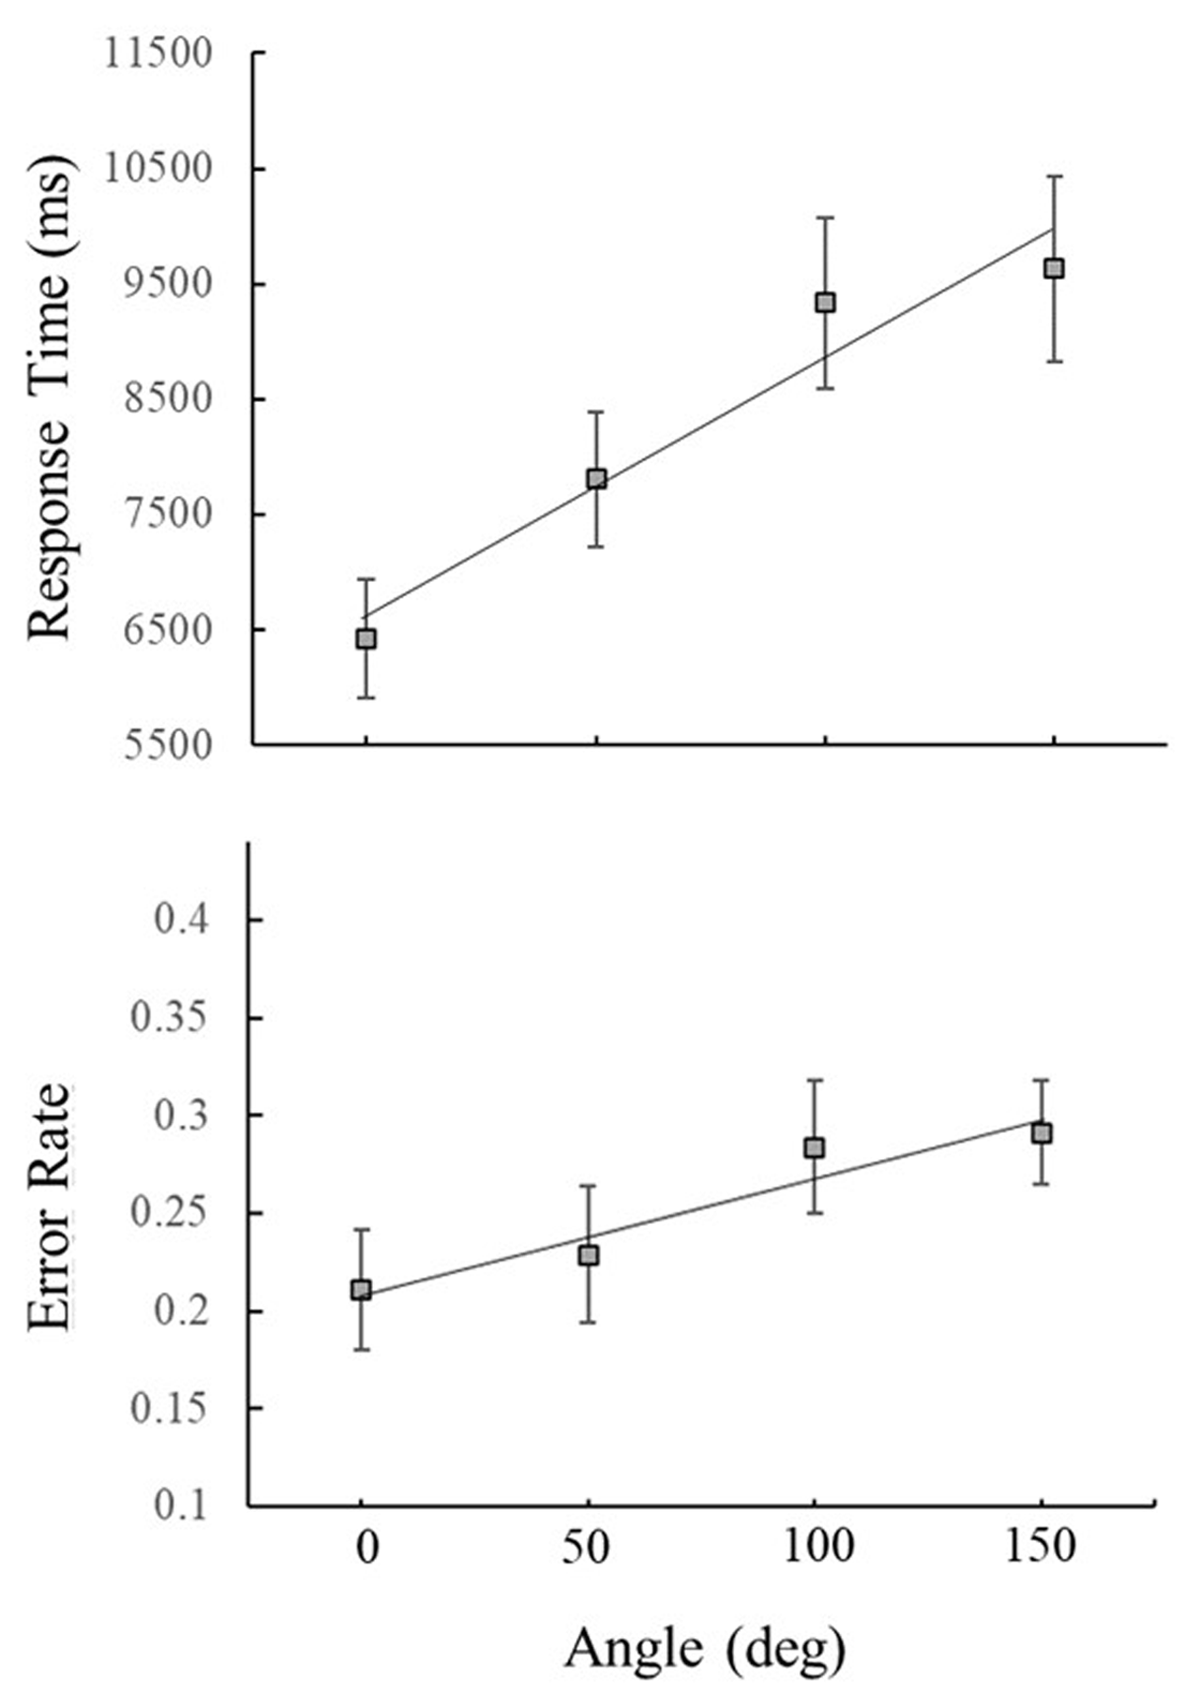
Figure 4
Mean response times (top) and error rates as a function of angular disparity between sample and test shapes collapsed across Same and Different Trials. Error bars represent the standard error. For response time, only data from Correct Trials was included.
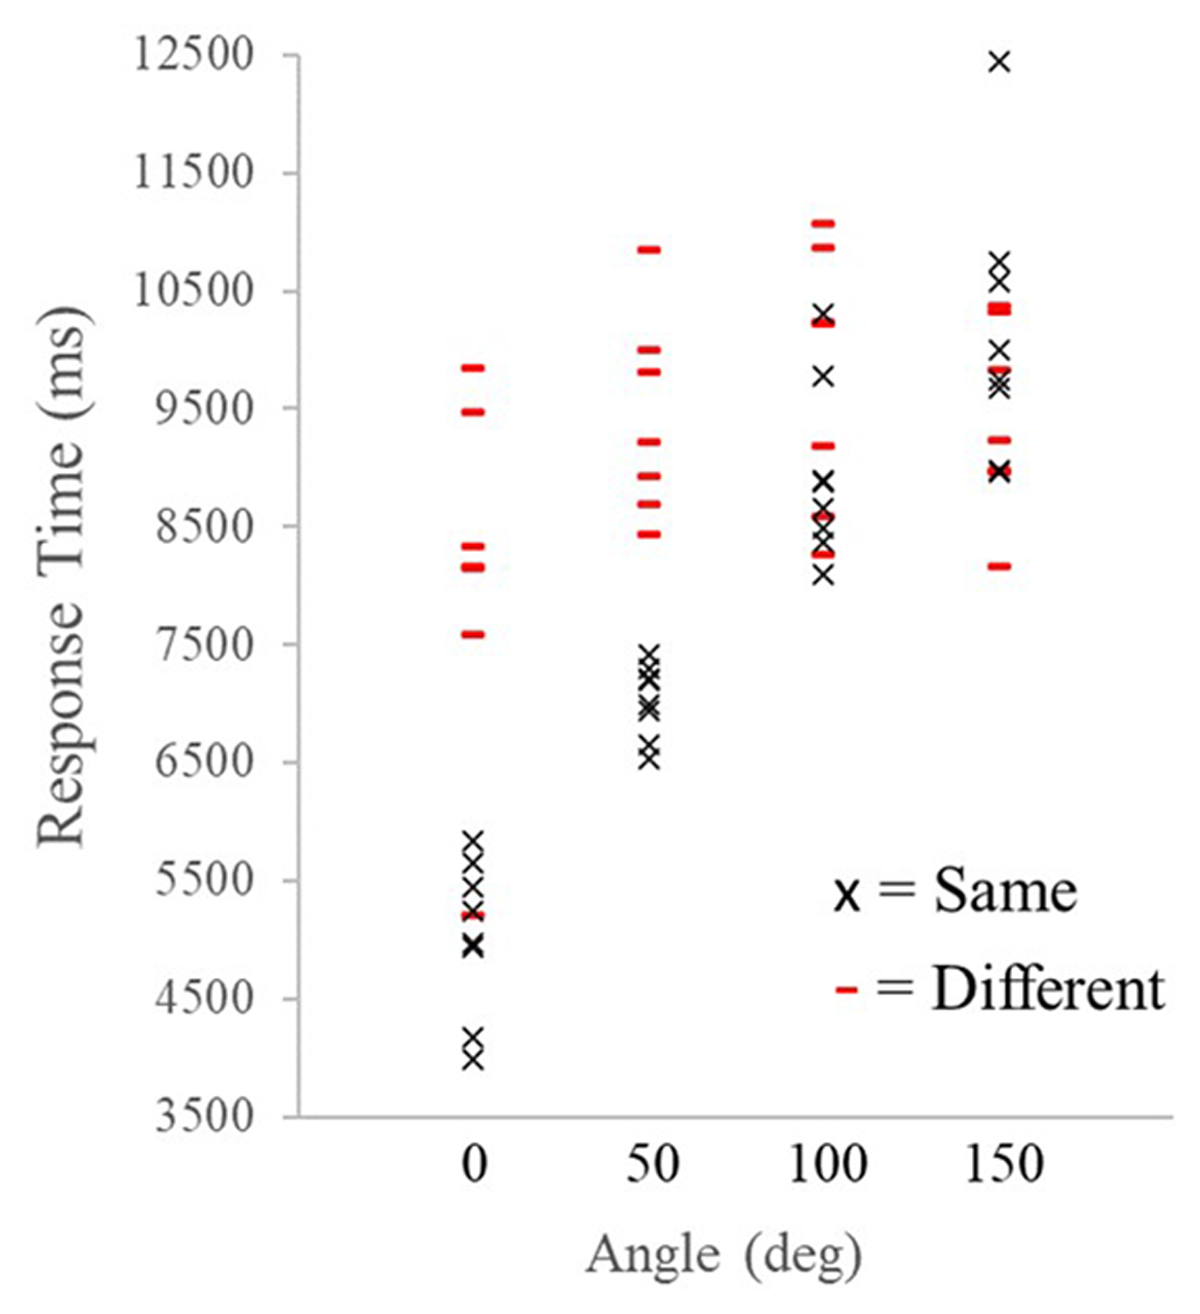
Figure 5
Mean response times for each of the eight stimuli used in the study as a function of angular disparity and broken down by trial type.