
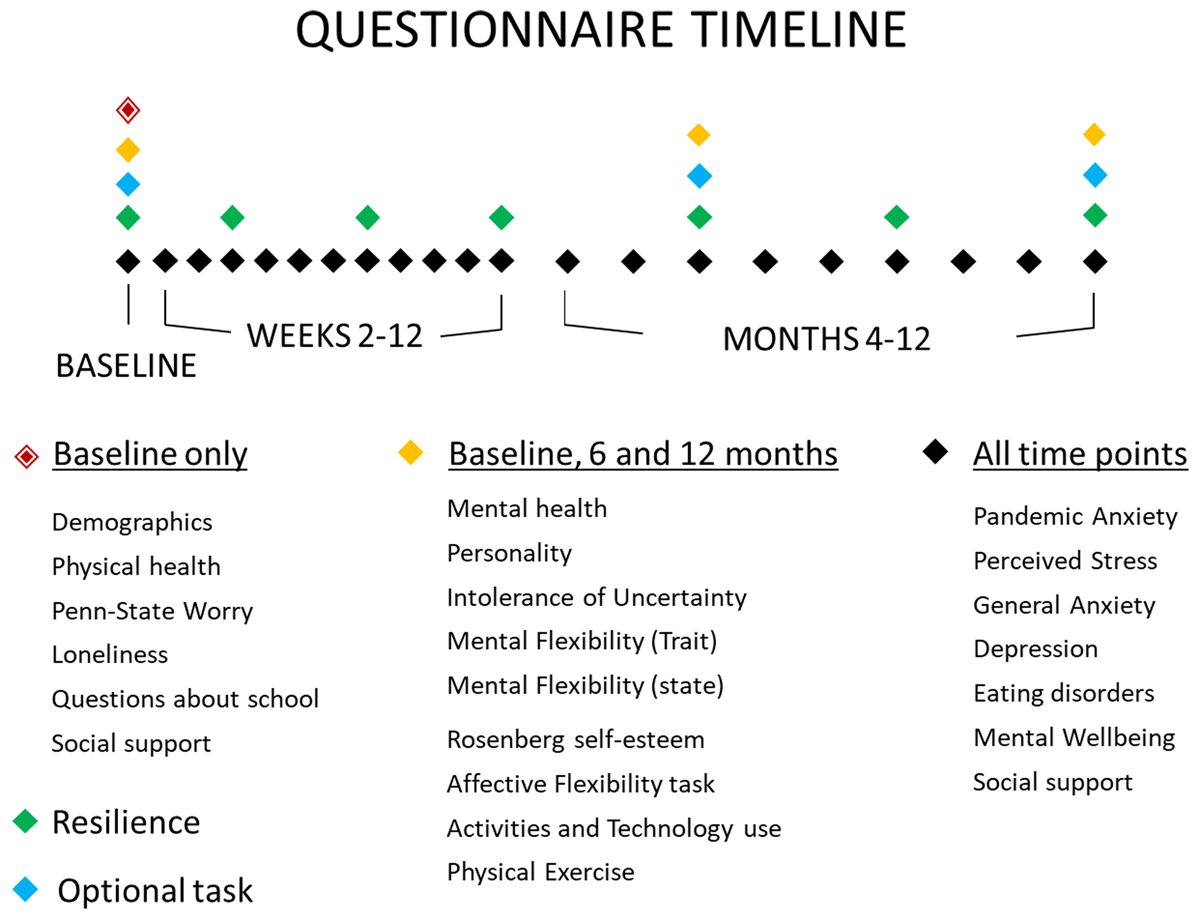
Figure 1
Survey structure.
Note: For baseline, weekly, and monthly surveys the coloured diamonds indicate the measures included. To visualise attrition, the bottom left panel depicts the number of participants that completed all questionnaires at each timepoint.
Table 1
Reported country of residence, stratified by group.
| PARENT | YOUNG PERSON | |
|---|---|---|
| n | 606 | 1467 |
| country (%) | ||
| Australia | 0 (0.0) | 1 (0.1) |
| Austria | 1 (0.2) | 0 (0.0) |
| British Indian Ocean Territory | 0 (0.0) | 2 (0.1) |
| Canada | 1 (0.2) | 1 (0.1) |
| Europe | 3 (0.5) | 19 (1.3) |
| Ghana | 1 (0.2) | 0 (0.0) |
| India | 3 (0.5) | 1 (0.1) |
| Indonesia | 1 (0.2) | 0 (0.0) |
| Ireland | 31 (5.1) | 28 (1.9) |
| Kenya | 0 (0.0) | 1 (0.1) |
| Netherlands | 0 (0.0) | 1 (0.1) |
| New Zealand | 1 (0.2) | 0 (0.0) |
| Norway | 0 (0.0) | 1 (0.1) |
| Pakistan | 1 (0.2) | 0 (0.0) |
| Philippines | 1 (0.2) | 0 (0.0) |
| Serbia | 0 (0.0) | 1 (0.1) |
| Turkey | 0 (0.0) | 1 (0.1) |
| Ukraine | 0 (0.0) | 1 (0.1) |
| United Kingdom | 464 (76.6) | 1196 (81.5) |
| United States | 9 (1.5) | 17 (1.2) |
| NA | 89 (14.7) | 196 (13.4) |
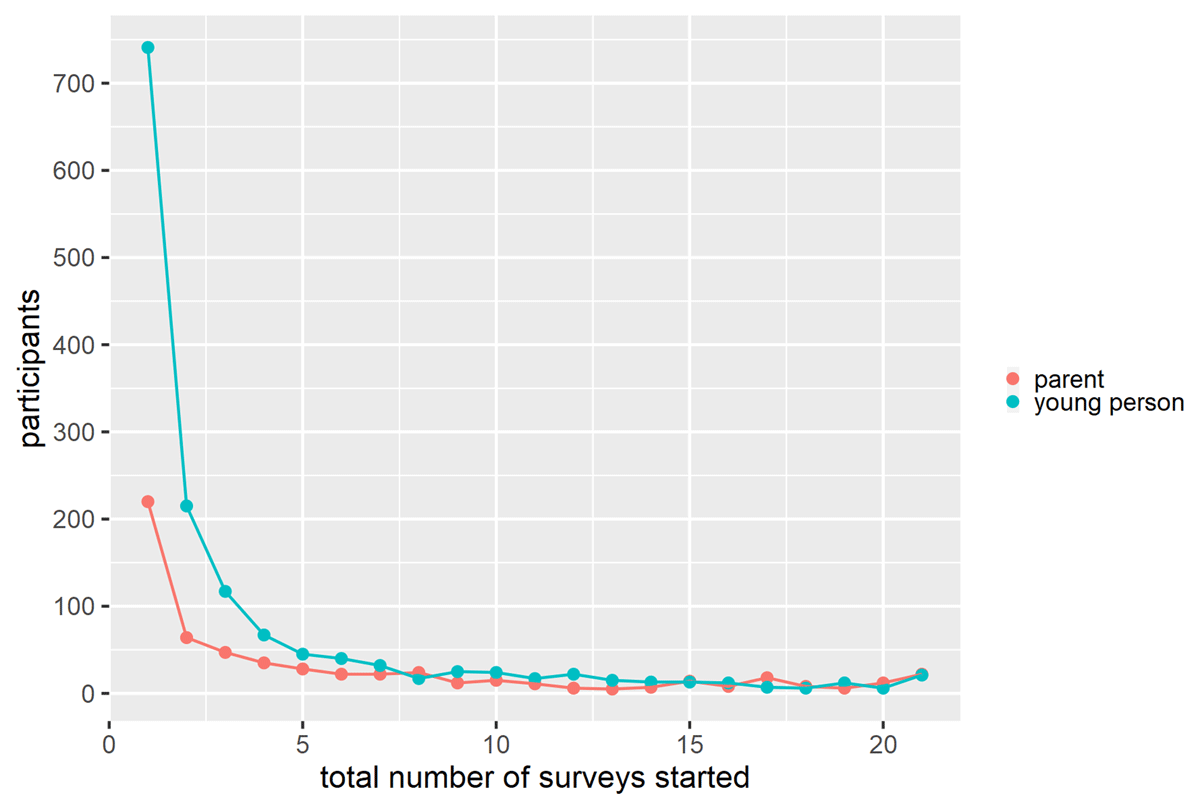
Figure 2
Completed surveys.
Note: Number of participants completing × surveys. E.g. approximately 50 young people started 5 survey time points, and approximately 150 participants total completed 15 or more survey timepoints.
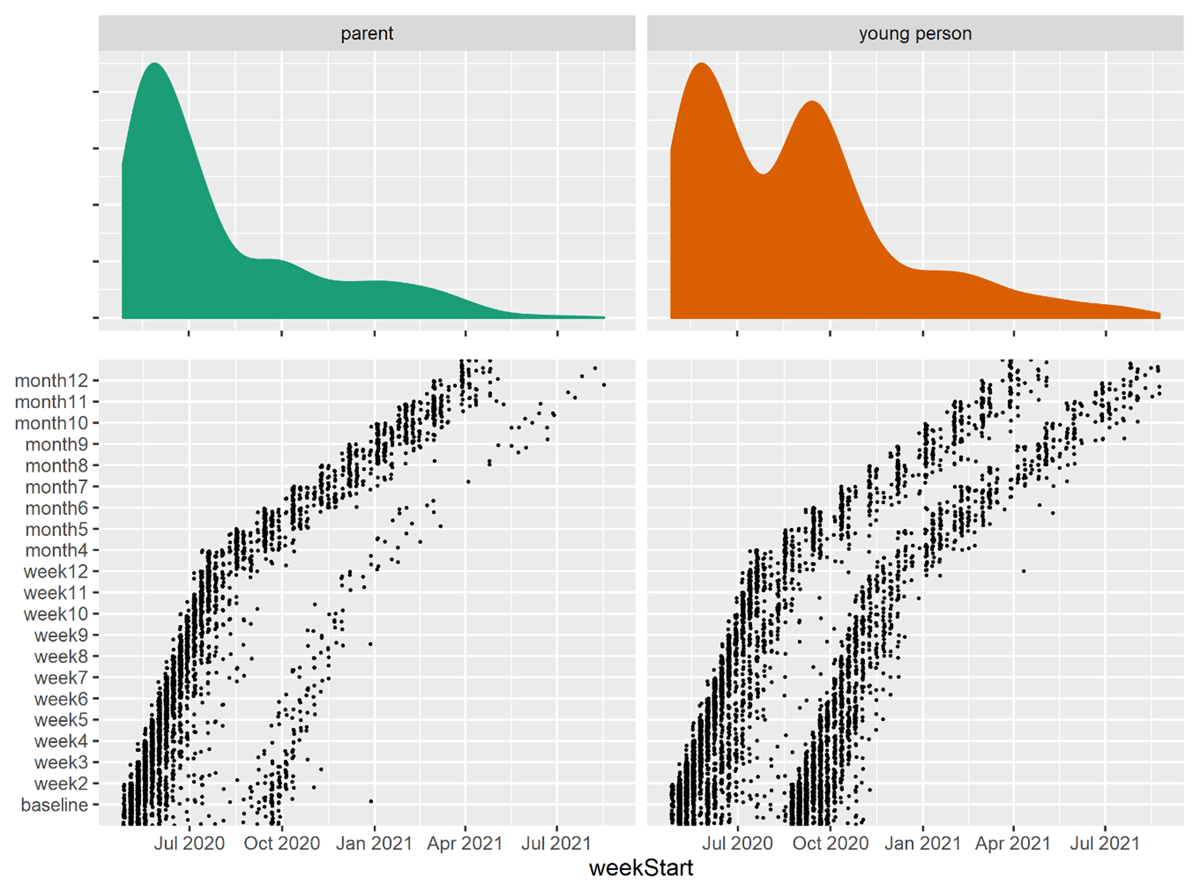
Figure 3
Raincloud plot of completed surveys.
Note: Raincloud plot of completed surveys showing the dates participants responded to each study time point. The ‘clouds’ in the top panels present the distributions of completed surveys over time. The ‘rain’ in the bottom panels present the completed surveys, with each point representing a completed survey.
Table 2
Participant descriptives from participants reporting UK as country of residence, stratified by group.
| PARENT | YOUNG PERSON | |
|---|---|---|
| N | 464 | 1196 |
| surveysran (mean (SD)) | 6.32 (6.19) | 3.95 (4.81) |
| age (mean (SD)) | 46.59 (6.30) | 15.55 (1.46) |
| gender (n (% group)) | ||
| Female | 399 (86.0) | 920 (76.9) |
| I use another term | 1 (0.2) | 41 (3.4) |
| Male | 61 (13.1) | 215 (18.0) |
| Prefer not to say | 3 (0.6) | 20 (1.7) |
| ethnicity (n (% group)) | ||
| Asian/Asian British – Indian, Pakistani, Bangladeshi, other | 30 (6.5) | 162 (13.5) |
| Black/Black British – Caribbean, African, other | 1 (0.2) | 36 (3.0) |
| Chinese/Chinese British | 3 (0.6) | 12 (1.0) |
| Middle Eastern/Middle Eastern British – Arab, Turkish, other | 2 (0.4) | 14 (1.2) |
| Mixed race – other | 3 (0.6) | 44 (3.7) |
| Mixed race – White and Black/Black British | 3 (0.6) | 28 (2.3) |
| Other ethnic group | 5 (1.1) | 8 (0.7) |
| Prefer not to say | 7 (1.5) | 25 (2.1) |
| White – British, Irish, other | 404 (87.1) | 861 (72.0) |
| NA | 6 (1.3) | 6 (0.5) |
Table 3
Reliability estimates (Chronbach’s alpha and MacDonald’s total omega) for calculated questionnaire scores at baseline, stratified by group.
| ALPHA | OMEGA | |||
|---|---|---|---|---|
| MEASURE | YOUNG PERSON | PARENT | YOUNG PERSON | PARENT |
| big5 Openness | 0.75 | 0.75 | 0.76 | 0.76 |
| big5 Conscientiousness | 0.64 | 0.63 | 0.69 | 0.69 |
| big5 Extraversion | 0.81 | 0.84 | 0.83 | 0.85 |
| big5 Agreeableness | 0.59 | 0.56 | 0.66 | 0.70 |
| big5 Neuroticism | 0.79 | 0.75 | 0.82 | 0.79 |
| Intolerance of Uncertainty | 0.96 | 0.95 | 0.97 | 0.96 |
| Mental Flexibility Questionnaire – Trait | 0.88 | 0.91 | 0.90 | 0.93 |
| Rosenberg Self-Esteem | 0.93 | 0.90 | 0.94 | 0.93 |
| Pandemic Anxiety Scale | 0.80 | 0.79 | 0.86 | 0.87 |
| Perceived Stress Scale | 0.82 | 0.76 | 0.86 | 0.83 |
| Patient Health Questionnaire (Depression) | 0.92 | 0.89 | 0.93 | 0.92 |
| Generalized Anxiety Scale | 0.93 | 0.92 | 0.94 | 0.95 |
| Mental Flexibility Scale – State | 0.91 | 0.95 | 0.93 | 0.96 |
| Eating Disorder Examination Questionnaire | 0.93 | 0.86 | 0.95 | 0.90 |
| Brief Resilience Scale | 0.89 | 0.93 | 0.92 | 0.95 |
| Short Warwick-Edinburgh Mental Wellbeing Scale | 0.91 | 0.90 | 0.94 | 0.93 |
| Penn State Worry Questionnaire – Child | 0.94 | 0.95 | ||
| Isolation – Child | 0.87 | 0.90 | ||
| Penn State Worry – Adult | 0.94 | 0.95 | ||
| Isolation – Adult | 0.86 | 0.90 | ||
[i] Note: Missing values indicate scale was not completed by that group.