
Table 1
Overview of study procedure.
| SESSION | STUDY PHASE | SUMMARY OF TASKS |
|---|---|---|
| Session 1 | Pretest |
|
| Session 2 | Intervention |
|
| Session 3 | Intervention |
|
| Immediate Posttest |
| |
| Session 4 | Delayed Posttest |
|
Table 2
Example problem as presented in each of the nine experimental conditions.
| COLOR CUES | ||||
|---|---|---|---|---|
| CONGRUENT (CC) | NEUTRAL (NC) | INCONGRUENT (IC) | ||
| Spacing Cues | Congruent (CS) | 10 + 4 × 8 – 3 | 10 + 4 × 8 – 3 | 10 + 4 × 8 – 3 |
| Neutral (NS) | 10 + 4 × 8 – 3 | 10 + 4 × 8 – 3 | 10 + 4 × 8 – 3 | |
| Incongruent (IS) | 10 + 4 × 8 – 3 | 10 + 4 × 8 – 3 | 10 + 4 × 8 – 3 | |
[i] Note: Bolded numbers and symbols were shown in orange font. See Figure 1 for an example.
Table 3
Student Demographic Information by Condition (N = 1,110).
| ALL | CSCC | CSIC | CSNC | ISCC | ISIC | ISNC | NSCC | NSIC | NSNC | |
|---|---|---|---|---|---|---|---|---|---|---|
| n = 1,110 | n = 151 | n = 127 | n = 92 | n = 112 | n = 117 | n = 122 | n = 128 | n = 139 | n = 122 | |
| (100.00%) | (13.61%) | (11.44%) | (8.28%) | (10.09%) | (10.54%) | (10.99%) | (11.54%) | (12.52%) | (10.99%) | |
| Gender | ||||||||||
| Male | 489 | 63 | 64 | 41 | 60 | 48 | 44 | 58 | 53 | 58 |
| (44.05%) | (5.68%) | (5.77%) | (3.69%) | (5.41%) | (4.32%) | (3.96%) | (5.23%) | (4.77%) | (5.23%) | |
| Female | 522 | 77 | 54 | 45 | 43 | 56 | 69 | 59 | 65 | 54 |
| (47.03%) | (6.94%) | (4.86%) | (4.05%) | (3.87%) | (5.05%) | (6.22%) | (5.32%) | (5.86%) | (4.86%) | |
| Not reported | 99 | 11 | 9 | 6 | 9 | 13 | 9 | 11 | 21 | 10 |
| (8.92%) | (0.99%) | (0.81%) | (0.54%) | (0.81%) | (1.17%) | (0.81%) | (0.99%) | (1.89%) | (0.90%) | |
| Race/Ethnicity | ||||||||||
| Asian | 445 | 65 | 49 | 40 | 45 | 52 | 55 | 36 | 49 | 54 |
| (40.09%) | (5.86%) | (4.41%) | (3.60%) | (4.05%) | (4.68%) | (4.95%) | (3.24%) | (4.41%) | (4.86%) | |
| White | 314 | 34 | 37 | 24 | 31 | 35 | 35 | 47 | 37 | 34 |
| (28.29%) | (3.06%) | (3.33%) | (2.16%) | (2.79%) | (3.15%) | (3.15%) | (4.23%) | (3.33%) | (3.06%) | |
| Hispanic Latino | 169 | 24 | 17 | 20 | 16 | 12 | 18 | 23 | 22 | 17 |
| (15.23%) | (2.16%) | (1.53%) | (1.80%) | (1.44%) | (1.08%) | (1.62%) | (2.07%) | (1.98%) | (1.53%) | |
| Black | 43 | 10 | 5 | 2 | 7 | 3 | 4 | 5 | 5 | 2 |
| (3.87%) | (0.90%) | (0.45%) | (0.18%) | (0.63%) | (0.27%) | (0.36%) | (0.45%) | (0.45%) | (0.18%) | |
| Multiple Races | 35 | 6 | 10 | 0 | 4 | 0 | 1 | 6 | 4 | 4 |
| (3.15%) | (0.54%) | (0.90%) | (0.00%) | (0.36%) | (0.00%) | (0.09%) | (0.54%) | (0.36%) | (0.36%) | |
| American Indian | 5 | 1 | 0 | 0 | 0 | 2 | 0 | 0 | 1 | 1 |
| (0.45% | 0.09% | (0.00%) | (0.00%) | (0.00%) | (0.18%) | (0.00%) | (0.00%) | (0.09%) | (0.09%) | |
| Not reported | 99 | 11 | 9 | 6 | 9 | 13 | 9 | 11 | 21 | 10 |
| (8.92%) | (0.99%) | (0.81%) | (0.54%) | (0.81%) | (1.17%) | (0.81%) | (0.99%) | (1.89%) | (0.90%) | |
| ESOL | 92 | 13 | 10 | 7 | 4 | 8 | 7 | 16 | 14 | 13 |
| (8.29%) | (1.17%) | (0.90%) | (0.63%) | (0.36%) | (0.72%) | (0.63%) | (1.44%) | (1.26%) | (1.17%) | |
| Gifted | 264 | 36 | 28 | 24 | 29 | 32 | 30 | 31 | 27 | 27 |
| (23.78%) | (3.24%) | (2.52%) | (2.16%) | (2.61%) | (2.88%) | (2.70%) | (2.79%) | (2.43%) | (2.43%) | |
| IEP | 92 | 9 | 15 | 10 | 10 | 6 | 4 | 13 | 11 | 14 |
| (8.29%) | (0.81%) | (1.35%) | (0.90%) | (0.90%) | (0.54%) | (0.36%) | (1.17%) | (0.99%) | (1.26%) | |
| IST | 72 | 11 | 7 | 4 | 10 | 6 | 9 | 8 | 10 | 7 |
| (6.49%) | (0.99%) | (0.63%) | (0.36%) | (0.90%) | (0.54%) | (0.81%) | (0.72%) | (0.90%) | (0.63%) | |
[i] Note: CSCC = congruent spacing congruent color, CSIC = congruent spacing incongruent color, CSNC = congruent spacing neutral color, ISCC = incongruent spacing congruent color, ISIC = incongruent spacing incongruent color, ISNC = incongruent spacing neutral color, NSCC = neutral spacing congruent color, NSIC = neutral spacing incongruent color, NSNC = neutral spacing neutral color, ESOL = English to Speakers of Other Languages, referring to the students who learned English in a non-English-speaking country or learned English as a second language in an English-speaking country, Gifted = Determined by the school district based on a nationally normed test that includes measures of mental ability, achievement, motivation, and creativity, IEP = Individualized Education Program status, referring to whether students are disabled or need special health care, IST = Instructional Support Team status, referring to whether students exhibit academic difficulties and need assistance from a team of teachers.
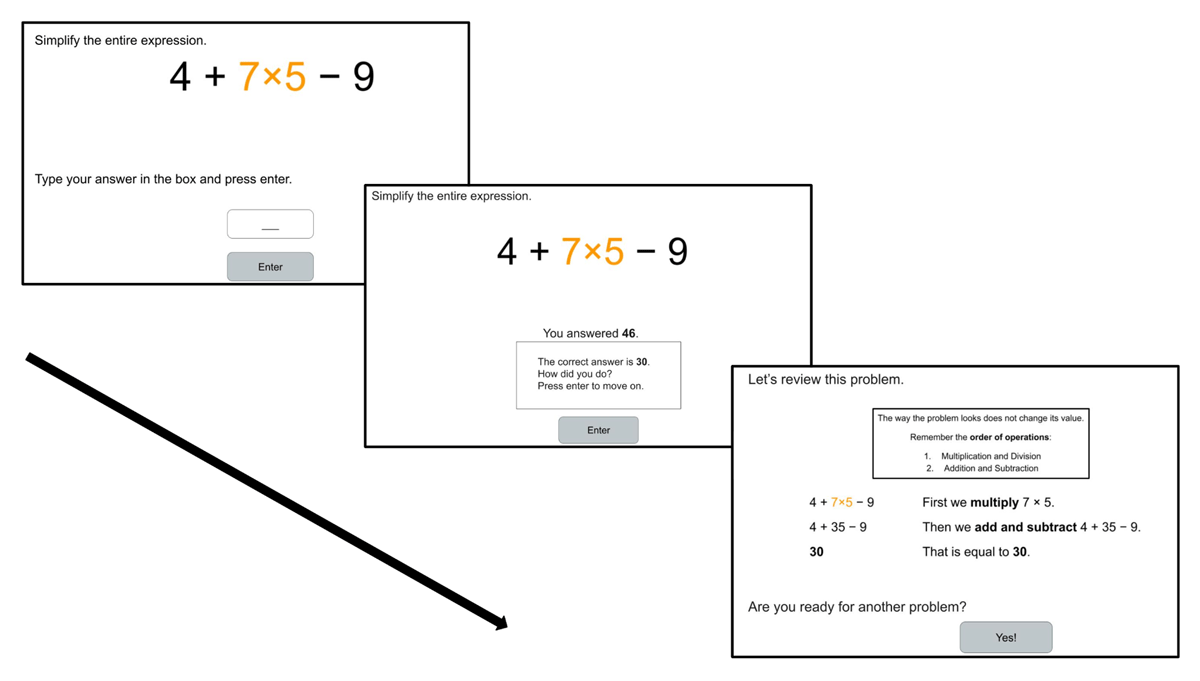
Figure 1
Example Screen Progression from a Practice Problem to Immediate Correctness Feedback to Worked Example (Congruent Spacing, Congruent Color [CSCC] Condition).
(Closser et al., under review).
Table 4
Description of each variable in the available intervention dataset on OSF.
| VARIABLE | DESCRIPTION | TYPE |
|---|---|---|
| stu_id | Student ID assigned in the study (non-identifiable) | character |
| Session | The session of the task | character |
| task | The name of the task | character |
| stim_num | Problem number | character |
| response | Students’ response for each problem or survey item | character |
| correct | Correctness of each problem | dichotomous |
| rt | Time taken to solve each problem (in milliseconds) | continuous |
| rt_fd | Time taken to view the feedback after each problem (in milliseconds) | continuous |
| rt_we | Time taken to view the worked example after each problem (in milliseconds) | continuous |
| condition | Assigned condition (e.g, CSCC, CSIC) | categorical |
Table 5
Description of each file in the full dataset that includes student assessment and demographic information (accessible once the DSA is completed).
| FILE NAME | CONTENTS | STRUCTURE |
|---|---|---|
| student-level dataset | ||
| student_all | Student performance data on pre, intervention, post, and delayed posttest | one row per student (wide format) |
| student_demo | Data provided by the school district on student demographics (e.g., gender, race/ethnicity) | |
| problem-level dataset | ||
| problem_meta | Metadata on the intervention problems (e.g., problem order, problem type) | one row per problem |
| pretest | Problem-level data on students’ prior knowledge of the order of operations | one row per student per problem (long format) |
| pre_pmet | Problem-level data on students’ prior perception of equivalence skills | |
| pre_assess | Problem-level data on pre-math anxiety, pre-math value, postdiction of performance | |
| training_1 | Problem-level data on intervention problems (session 2) (publicly available on OSF) | |
| training_2 | Problem-level data on intervention problems (session 3) (publicly available on OSF) | |
| posttest | Problem-level data on students’ posttest knowledge of the order of operations | |
| post_pmet | Problem-level data on students’ post-perception of equivalence skills | |
| post_assess | Problem-level data on post-helpfulness rating and postdiction of performance | |
| delayed_post | Problem-level data on students’ delayed posttest knowledge of the order of operations | |
| delayed_assess | Problem-level data on delayed posttest helpfulness rating and postdiction of performance | |