
(1) Overview
Repository Location: ahttps://zenodo.org/records/21043792
Context
Over the past decade, a new genre of investigative practice has emerged at the intersection of journalism, human rights documentation, and open-source intelligence (OSINT). Organisations including Bellingcat, Forensic Architecture, and Airwars have developed a set of visual techniques — satellite imagery analysis, 3D architectural reconstruction, geolocation mapping, and photogrammetry — that are computationally structured, visually persuasive, and increasingly influential in public, legal, and policy contexts. Airwars, established in 2014, has become one of the most significant OSINT organisations working on civilian harm monitoring, producing both quantitative tracking databases and in-depth visual investigations, with a particular focus on Iraq, Syria, Ukraine, and Gaza. Scholars working on digital conflict documentation, platform accountability, and the politics of evidence have engaged with OSINT methods as examples of a new form of distributed, technologically-mediated witnessing (Keenan and Weizman, 2012; Weizman, 2017). Airwars is notable for operating with relative transparency about its sourcing and methodology, making it well-suited as an initial case for methodological analysis. Yet despite the rapid proliferation of these techniques, the field lacks systematic empirical data on visual techniques employed by Airwars or OSINT groups more broadly, how they are combined, and how much investigators disclose about the assumptions and limitations embedded in them.
Quantitative approaches to visual investigation content remain rare. Quantitative content analysis has a long tradition in communication studies (Krippendorff, 2004; Neuendorf, 2017), and has been applied to news photography (Bock, 2016), broadcast journalism (Cushion et al., 2017), and social media imagery (Marston, 2020). Visual scene analysis — the systematic coding of what is present in an image or video and how it is structured — has been developed in both film studies and computational contexts (Bateman, 2014; Bell & Milic, 2002). Neither tradition, however, has been applied systematically to visual investigations, which combine indexical documentary imagery with computational processing in ways that resist conventional analysis. The Measurable Truth dataset addresses that gap1 by providing empirical grounding for a set of research questions that cannot be answered through close reading of individual investigations alone: (1) the extent to which visual investigators account for their own methods and what predicts greater or lesser methodological disclosure; (2) the combinations of observational and computational techniques that characterise different types of investigation, and whether recognisable methodological profiles are associated with particular subject matters, institutions, or time periods; (3) how presentational format — interactive database, linear article, standalone video — relates to methodological composition; (4) the contexts in which visual investigations circulate, including how collaboration with news media partners affects an investigation’s technique profile, reflexivity, or intended audience. The Measurable Truth dataset is the first structured, quantitative coding of visual investigation technique composition and methodological reflexivity, designed as longitudinal infrastructure: the schema, vocabulary, and ratio system are intended to persist as the corpus expands to other institutions and time periods. This first version will be expanded for deeper analysis through coding of a broader corpus.
(2) Method
Steps
The Measurable Truth dataset was produced through manual close-reading and real-time observation of each investigation in the corpus. The coding structure comprises 46 variables organised into four thematic groups (Methodological Reflexivity, Technique Composition, Circulation Context, Presentational Mode — see below), applied through a two-level data architecture: each investigation generates one row of investigation-level information (IDs of the form INV###) and a variable number of technique-instance rows (IDs of the form INV###_T##) (see Figure 1). These two tables are interleaved in the primary Excel spreadsheet and separated into discrete files in the JSON and CSV exports.
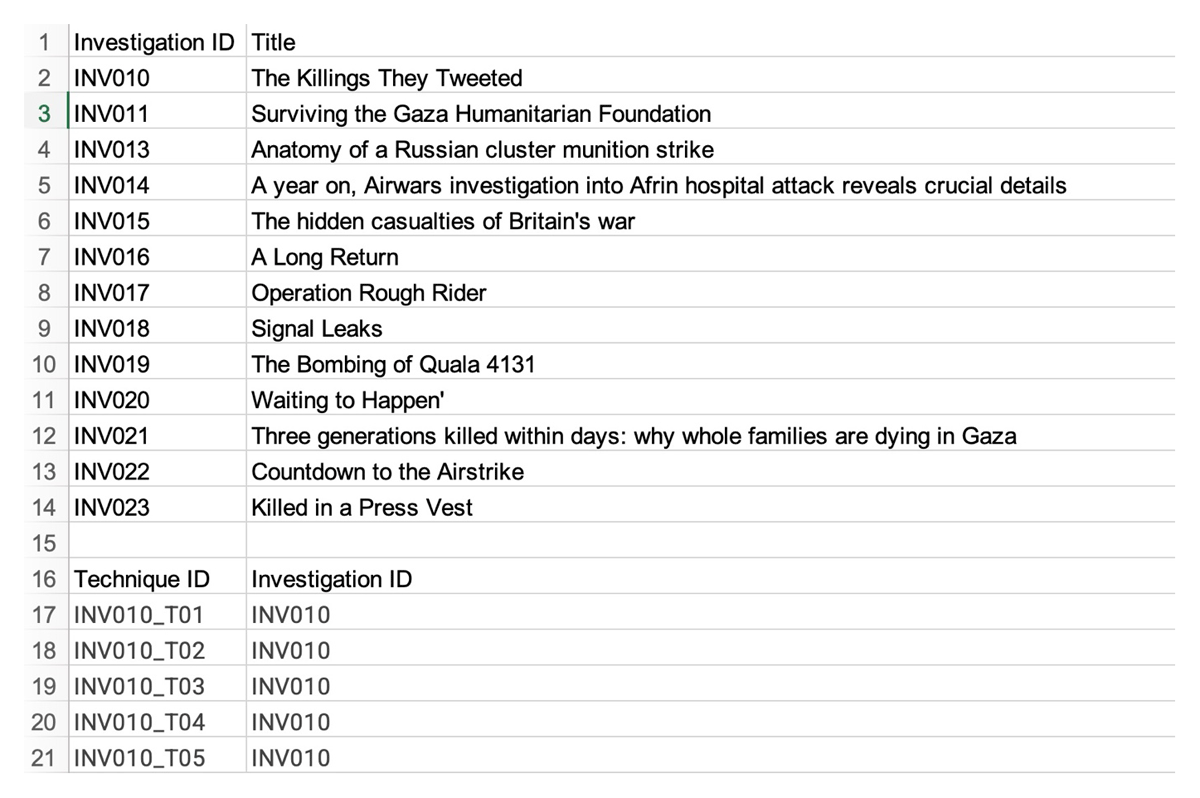
Figure 1
Dataset architecture showing the relationship between investigation-level rows (INV###) and technique-instance rows (INV###_T##).
The four thematic groups capture distinct dimensions of each investigation. Methodological reflexivity measures how explicitly an investigation accounts for its own methods, scored on a five-point ordinal scale (0–4) ranging from no methodological disclosure through to a pedagogical mode that interrogates the epistemic choices involved. Technique composition operates at the technique-instance level: each visual technique observed is coded individually with a duration measurement in seconds or an instance count for non-linear investigations, aggregated by category (Observational, Computational, Hybrid, or Synthetic), and expressed as proportions of total technique duration or count per investigation, generating four ratio scores that sum to 1.0. Each technique instance is additionally coded for data source type, visual quality, interactivity, temporal and spatial properties, rhetorical function, and confidence level. Circulation context records publication context, redistribution, access level, and intended audience. Presentational mode captures format, interactivity, and temporality. Additional investigation-level variables record subject matter, geographical focus, organisation type, publication date, and collaboration status. The full variable list with value definitions and the taxonomy of 27 technique types is provided in Appendix A.
Two technique types within this taxonomy are particularly indicative of their respective categories. Witness video — typically uploaded to social media by civilians or combatants and verified by the investigator — is a defining Observational/Photographic technique: it anchors an investigation in indexical documentary footage whose evidentiary weight depends on provenance rather than transformation. 3D architectural reconstruction, by contrast, exemplifies the Computational category: it transforms source material into a navigable model that permits spatial analysis impossible in the original footage, trading indexical immediacy for analytical reach. Technique instances were logged as they appeared during observation, with durations recorded in seconds or proportion of total count. Upon completing each investigation, individual durations were summed, grouped by category, and converted to proportional ratios. Scratch notes were then transferred to the Excel spreadsheet according to the codebook. Additional metadata was drawn from Airwars’ own page metadata and inline text. All coding was conducted by the sole author between 22 January and 20 February 2026 using Microsoft Excel.
Sampling strategy
Corpus construction began with a broader survey of visual investigations produced between 2015 and 2025 across OSINT groups, news media, Non-Governmental Organisations (NGOs), and documentary filmmakers. Airwars was selected as a purposive sample to stress-test the coding structure, as its investigations incorporate sufficient variety of observational and computational techniques. The corpus was drawn exhaustively from the Airwars website2 (see Figure 2), comprising all investigation pages carrying the ‘Visual’ category tag. These span 2021–2025; no earlier Airwars investigations carry this designation, accounting for the temporal scope.
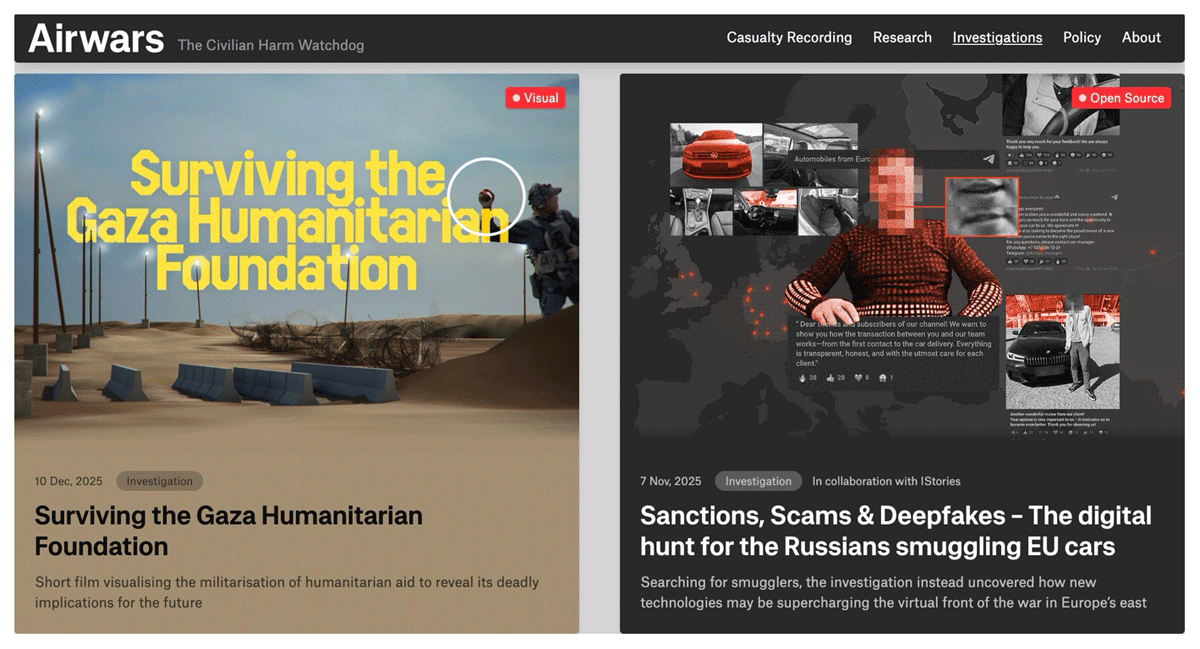
Figure 2
A screenshot of the Airwars website, illustrating the presentation of accessible investigations, including the primary category tag in the top right of each panel.
Quality control
A Review Required column flags rows where a coding decision was uncertain or where the codebook required revision during the process. For example, the technique designation ‘Social Media Evidence’ was added to the controlled vocabulary partway through coding, based on observations of social media screenshots as visual evidence not anticipated in the initial schema; affected rows were retroactively flagged and recoded consistently.
Importantly, there is currently no inter-rater reliability for this pilot dataset, and thus the dataset should be viewed as a proof of concept for further expansion, rather than a source of dependable qualitative conclusions. However, this is a priority for the expanded dataset to ensure reliable results when applying this schema to a wider corpus drawn from a variety of institutions and subject matters.
(3) Dataset Description
Repository name
Zenodo
Object name
Airwars Visual Investigations Corpus.csv
Format names and versions
Microsoft Excel (.xlsx); JSON; CSV; HTML
Creation dates
2026-01-22 to 2026-02-20
Dataset creators
Isaac Parkinson, King’s College London (Conceptualisation; Methodology; Data Curation; Formal Analysis; Visualisation)
Language
English
License
CC0
Publication date
2026-02-24
(4) Reuse Potential
The dataset’s coding schema, vocabulary, and ratio system are generic enough to apply to visual investigations from any institution or subject domain, provided the investigations are publicly accessible and involve visual techniques that can be observed and timed. Researchers across media studies, journalism studies, science and technology studies, legal studies, human rights scholarship, and documentary film studies could reuse or adapt the schema in several ways.
The most direct reuse pathway is aggregation: researchers could apply the same 46-variable instrument to corpora from other institutions — the New York Times Visual Investigations team or Forensic Architecture, for example — and merge the resulting datasets with this one for comparative analysis. The reflexivity coding scale (0–4) and the four-category technique taxonomy also function as transferable standalone instruments. A researcher studying environmental journalism might use the reflexivity scale to compare how different outlets account for their use of satellite data in climate reporting; a documentary film scholar could track the balance between witness video and 3D architectural reconstruction across investigative documentaries, asking whether films weighted toward computational reconstruction are more or less explicit about their epistemic choices than those anchored in civilian-sourced footage. Beyond these comparative applications, the dataset introduces a reference baseline for the state of visual investigation methodology in the early 2020s, against which future profiles could be measured. Independent coding of the same investigations by other researchers would further contribute inter-rater reliability to the data, particularly valuable for refining the reflexivity scale, where boundaries between adjacent scores may be less stable across coders than the endpoints.
The principal limitation is sample size. With 13 investigations from a single institution, statistics in this release should be treated as directional — useful for hypothesis generation and demonstrating the coding instrument works, but not sufficient for confident inferential claims. Multivariate regression and cross-institutional clustering analysis require more investigations before producing reliable results; the schema is designed as longitudinal infrastructure to accommodate this expansion.
Additional File
The additional file for this article can be found as follows:
Notes
[1] The dataset captures a field in active transition. Two investigations from 2025 — both focused on airstrikes in Yemen — achieve a purely computational technique composition (0.75 Computational ratio, 0.00 Observational ratio), a mode entirely absent from the 2021–2023 data. Whether this represents a durable shift, driven by the physical inaccessibility of conflict zones and the maturation of remote sensing tools, or an anomaly specific to this moment and subject matter, is a question this dataset’s expansion is designed to track over time.
[2] https://airwars.org/investigations/ (Last accessed: 13 July 2026).
Author Contributions
Isaac Parkinson: Conceptualisation, Data Curation, Methodology, Visualisation, Writing – original draft, Writing – review & editing.