
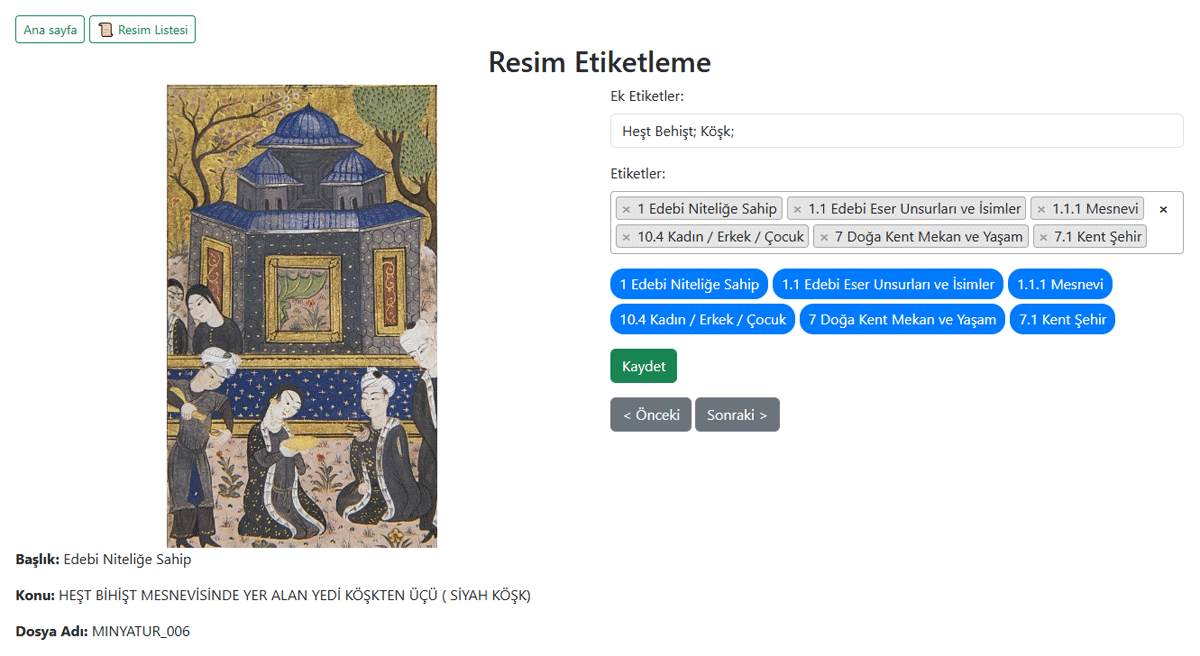
Figure 1
Tagging interface.2
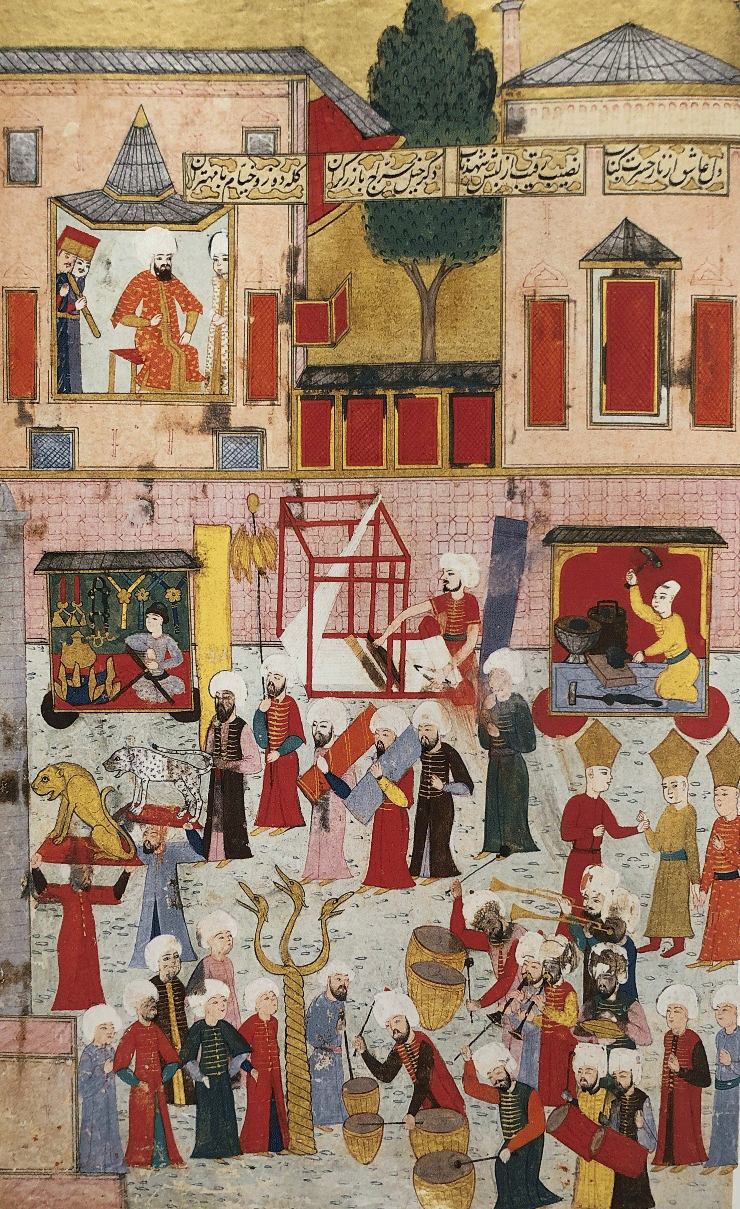
Figure 2
“A Segment of Shopkeepers Passing Through Atmaipazar Square during the Circumcision Feast of Murad III’s Son” (şehinşehnâme, Topkapı Palace Library, attributed to Seyid Lokman).
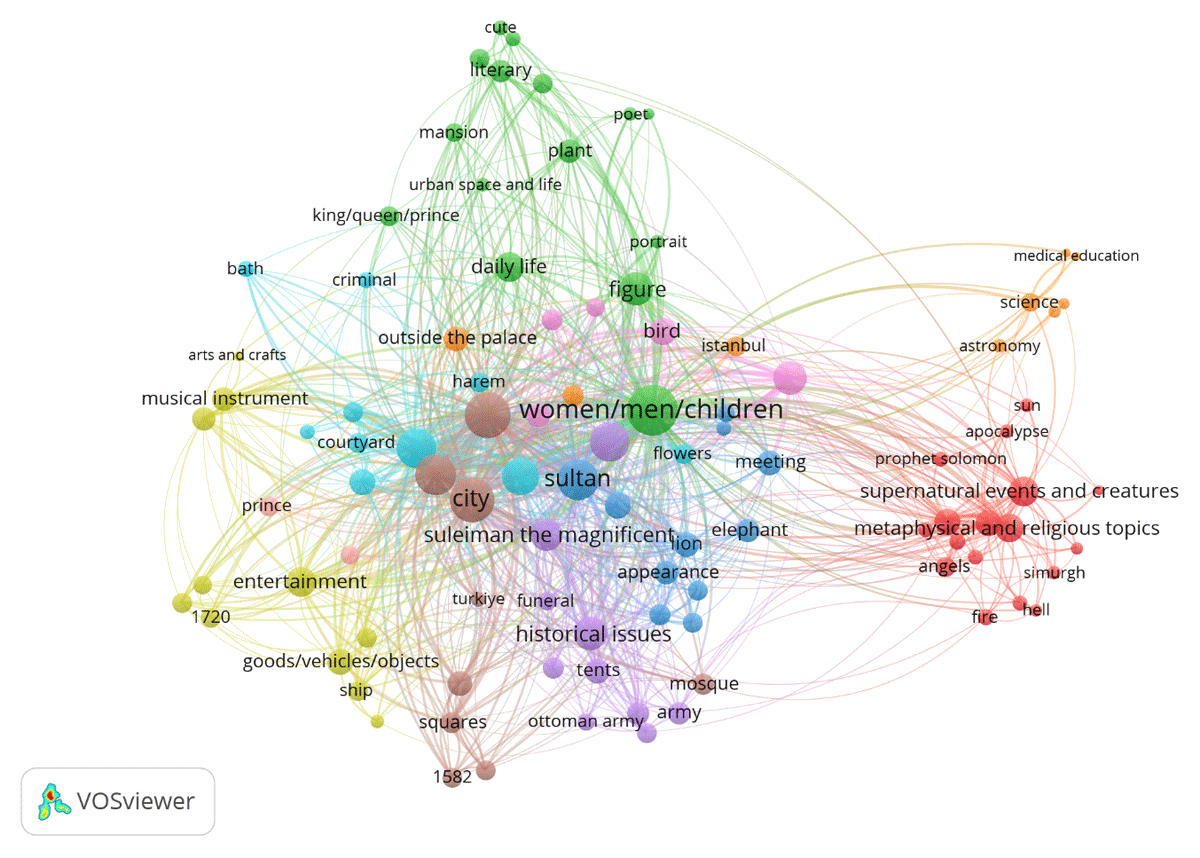
Figure 3
Thematic structures through co-occurrence analysis.
Table 1
Accuracy results of the supervised learning process for training and validation sets.
| STAGE | TRAINING ACCURACY | VALIDATION ACCURACY |
|---|---|---|
| Initial (Epoch 1) | 30.5% | 43.0% |
| Middle (Epoch 5) | 57.6% | 47.6% |
| Final (Epoch 10) | 62.5% | 48.8% |
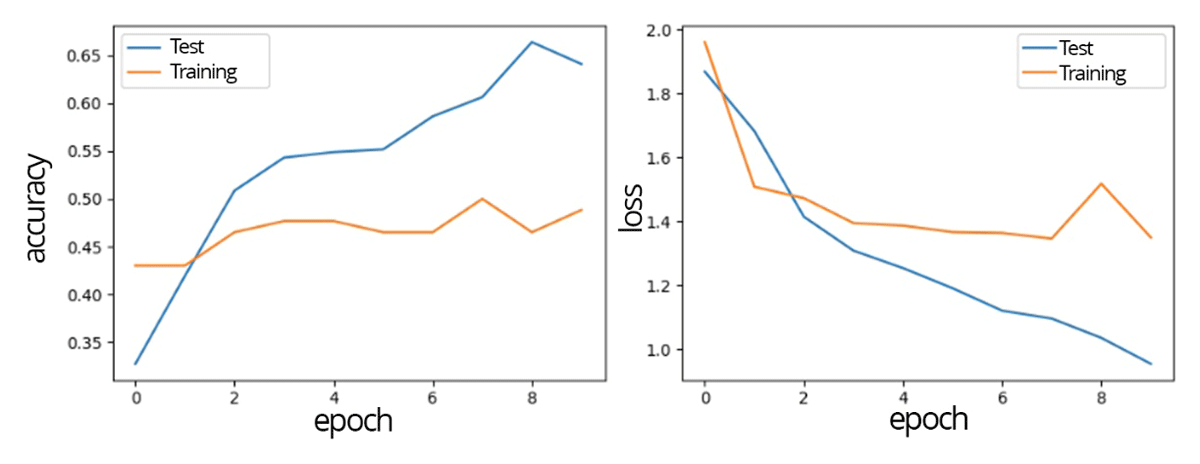
Figure 4
Accuracy and loss values during supervised learning training.
Table 2
Performance metrics for the unsupervised learning process.
| METRIC | DESCRIPTION | BEST RESULT |
|---|---|---|
| Silhouette score | Intra-cluster similarity vs. inter-cluster difference | 0.247 |
| Davies–Bouldin index | Cluster separation quality | 2.39 |
| Calinski–Harabasz | Cluster distinction strength | 117.5 |
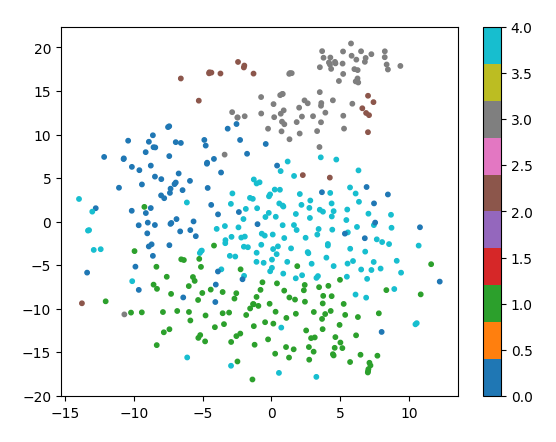
Figure 5
t-SNE visualization of clusters obtained in the unsupervised process.