
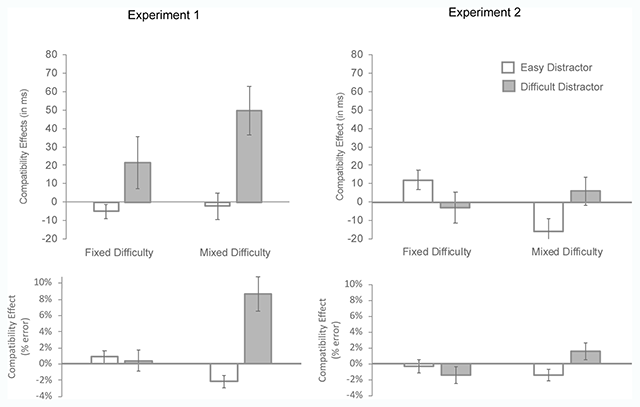
Figure 3
Mean compatibility effect (incompatible minus compatible) by condition of search type (fixed difficulty vs. mixed difficulty) and distractor difficulty (easy vs. difficult). Upper panel: Mean effect of reaction times (in milliseconds). Lower panel: Mean effect on error rates (in percentage).
Table 2
Mean RTs (in milliseconds) and accuracy rates (in percentage) on invalid-cue trials in Experiment 1 by conditions of cue-target compatibility, cued-distractor difficulty and search type. The numbers between square brackets represent the standard errors.
| All-easy | All-difficult | Mixed-easy | Mixed-difficult | |||||
|---|---|---|---|---|---|---|---|---|
| Reaction times | ||||||||
| Compatible | 640 | [23] | 904 | [31] | 759 | [23] | 753 | [23] |
| Incompatible | 635 | [21] | 925 | [30] | 757 | [25] | 803 | [24] |
| Accuracy | ||||||||
| Compatible | 96.3% | [1.0%] | 93.7% | [1.5%] | 91.9% | [1.4%] | 96.4% | [0.8%] |
| Incompatible | 95.4% | [1.0%] | 93.3% | [1.7%] | 94.0% | [0.9%] | 87.8% | [2.0%] |
Table 4
Mean RTs (in milliseconds) and accuracy rates (in percentage) on invalid-cue trials in Experiment 2 by conditions of cue-target compatibility, cued-distractor difficulty and search type. Standard errors are reported in brackets.
| All-easy | All-difficult | Mixed-easy | Mixed-difficult | |||||
|---|---|---|---|---|---|---|---|---|
| Reaction times | ||||||||
| Compatible | 640 | [23] | 904 | [31] | 759 | [23] | 753 | [23] |
| Incompatible | 635 | [21] | 925 | [30] | 757 | [25] | 803 | [24] |
| Accuracy | ||||||||
| Compatible | 96.3% | [1.0%] | 93.7% | [1.5%] | 91.9% | [1.4%] | 96.4% | [0.8%] |
| Incompatible | 95.4% | [1.0%] | 93.3% | [1.7%] | 94.0% | [0.9%] | 87.8% | [2.0%] |