
Table 1
Mean semantic and lexical properties as a function of semantic type and relatedness strength (standard deviations are provided in parentheses).
| Characteristic | High-Taxonomic | Low-Taxonomic | High-Thematic | Low-Thematic | Filler | Comparison |
|---|---|---|---|---|---|---|
| Similarity rating | 5.11 (.48) | 3.61 (.345) | 2.59 (.572) | 2.19 (.749) | t = –10.53, p < .001++ | |
| Relatedness rating | 3.05 (.386) | 2.51 (.354) | 4.87 (.537) | 4.04 (.309) | t = 12.03, p < .001++ | |
| # of Letters | 5.12 (1.74) | 5.67 (1.67) | 5.32 (1.43) | 5.47 (1.74) | 5.46 (1.68) | ts < .718 |
| # of Syllables | 1.53 (.563) | 1.68 (.692) | 1.59 (.657) | 1.65 (.774) | 1.63 (.665) | ts < 1.13 |
| # of Phonemes | 4.14 (1.63) | 4.32 (1.34) | 4.26 (1.37) | 4.44 (1.46) | 4.45 (1.53) | ts < .82 |
| Ortho_N* | 8.18 (8.91) | 6.42 (7.01) | 5.90 (6.97) | 7.76 (8.66) | 7.19 (8.07) | ts < .91 |
| Phono_N* | 15.6 (16.5) | 13.39 (14.87) | 12.4 (14.6) | 12.5 (13.6) | 13.9 (14.5) | ts < 1.57 |
| Log(WF)* | 2.63 (.665) | 2.55 (.618) | 2.71 (.625) | 2.51 (.570) | 2.75 (.646) | ts < 1.80 |
| Log(CD)* | 2.36 (.636) | 2.31 (.570) | 2.49 (.558) | 2.58 (.683) | 2.49 (.601) | ts < 1.51 |
| Imageability* | 583 (37.6) | 584 (36.81) | 569 (44.4) | 582 (27.1) | 578 (44.2) | ts < 1.51 |
[i] Note: Word length in letters and number of phonemes obtained from the Speech & Hearing Lab Neighborhood Database at Washington University in St. Louis; stimuli were also matched on word frequency (SUBTLEXUS; Brysbaert & New, 2009), orthographic and phonological neighborhood size (CLEARPOND; Marian, Bartolotti, Chabal, & Shook, 2012), and imageability (MRC Psycholinguistic Database; Coltheart, 1981). *Imageability – ratings for 46 words not available; *Log (CD; contextual diversity) – ratings for 10 words not available; *Log (WF; word frequency) – ratings for 10 words not available; *Phono_N (number of phonographic neighbors) – ratings for 15 words not available; *Ortho_N (number of orthographic neighbors) – ratings for 15 words not available. ++the difference between taxonomic and thematic conditions, collapsed across relatedness strength.
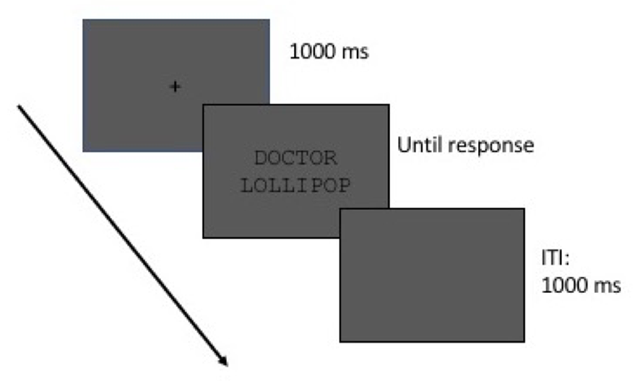
Figure 1
Schematic outline of a single experiment trial.
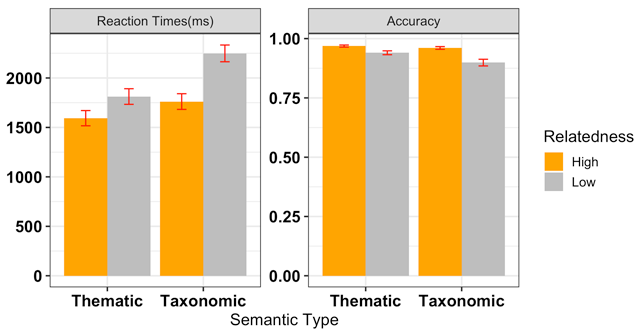
Figure 2
Mean Raw RTs (left) and Accuracy (right) as a function of Semantic Type and Relatedness Strength. Error bars reflect 95% Confidence Intervals (CIs). RT Model: -1000/rt ~ type * strength + (1 + type * strength | participant) + (1 | item); Accuracy Model: accuracy ~ type * strength + (1 + type | participant) + (1 | item).
Table 2
Growth Curve Analysis Results for Baseline-Corrected Pupil Dilation. Values are the coefficient estimates with Standard Errors in parentheses.
| Overall | Semantic Type | Relatedness Strength | Type: Strength | |||||
|---|---|---|---|---|---|---|---|---|
| Intercept | 0.06 (0.01) | *** | –0.00 (0.00) | –0.00 (0.00) | 0.00 (0.00) | |||
| Linear | 0.12 (0.03) | ** | –0.01 (0.01) | * | –0.02 (0.01) | *** | 0.02 (0.01) | ** |
| Quadratic | –0.07 (0.02) | ** | –0.01 (0.01) | –0.01 (0.01) | ** | 0.02 (0.01) | ** | |
| Cubic | 0.01 (0.02) | 0.01 (0.01) | 0.00 (0.01) | 0.00 (0.01) | ||||
[i] ***p < 0.001; **p < 0.01; *p < 0.05. Model: pupil ~ (poly1 + poly2 + poly3) * type * strength + ((poly1 + poly2 + poly3) + type * strength|subject).
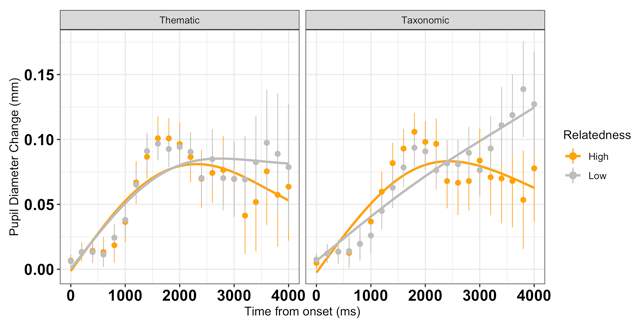
Figure 3
Baseline-corrected peak pupil dilation (dots, with SE vertical bars) overlaid with the GCA model fit (solid lines) as a function of semantic type and relatedness strength from stimulus onset until 4200 ms (200 ms time bins). Compared to low relatedness trials, on high relatedness trials, pupil diameter has a shallower slope and rises more quickly, then begins to decline. On low relatedness trials, the pupil dilation is steeper, slower, and longer-lasting, particularly for taxonomically related pairs.