
Table 1
Summary of normative measures for the 237 photographs.
| VARIABLE | QUEBEC FRENCH | FRANCE FRENCH | ||||||
|---|---|---|---|---|---|---|---|---|
| MEAN | SD | MIN | MAX | MEAN | SD | MIN | MAX | |
| Modal name agreement (%) | 83.81 | 18.58 | 25 | 100 | 83.34 | 18.38 | 33.02 | 100 |
| H-value | 0.67 | 0.66 | 0 | 3.12 | 0.73 | 0.67 | 0 | 3.20 |
| Proportion of blank responses (%) | 0.64 | 1.00 | 0 | 12.38 | 0.78 | 0.91 | 0 | 7.55 |
| Subjective word frequency (172 items) (Desrochers & Thompson, 2009) | 4.34 | 1.07 | 1.75 | 6.43 | ||||
| Objective word frequency (224 items) (New et al., 2004) | 29.51 | 60.79 | 0 | 570.3 | ||||
Table 2
Highest and Lowest H-Value Items (N = 20 each) in France French and Quebec French.
| FRANCE FRENCH | QUEBEC FRENCH | ||||||||||
|---|---|---|---|---|---|---|---|---|---|---|---|
| HIGHEST H-VALUES (N = 20) | LOWEST H-VALUES (N = 20) | HIGHEST H-VALUES (N = 20) | LOWEST H-VALUES (N = 20) | ||||||||
| ITEM NO. | MODAL NAME | H-VALUE | ITEM NO. | MODAL NAME | H-VALUE | ITEM NO. | MODAL NAME | H-VALUE | ITEM NO. | MODAL NAME | H-VALUE |
| 107 | carafe | 3.20 | 113 | clé | 0 | 196 | ciseau à bois | 3.12 | 6 | lit | 0 |
| 196 | lime | 2.93 | 120 | parapluie | 0 | 197 | boulon | 2.85 | 10 | chaise | 0 |
| 15 | verre | 2.87 | 134 | tomate | 0 | 179 | cor | 2.78 | 21 | fourchette | 0 |
| 3 | télévision | 2.50 | 136 | oignon | 0 | 107 | pichet | 2.49 | 32 | jupe | 0 |
| 179 | cor | 2.39 | 144 | asperges | 0 | 45 | lumière | 2.44 | 48 | kangourou | 0 |
| 35 | manteau | 2.37 | 159 | moto | 0 | 41 | scarabée | 2.24 | 57 | zèbre | 0 |
| 49 | raton laveur | 2.37 | 180 | accordéon | 0 | 156 | patin à roues alignées | 2.22 | 58 | vache | 0 |
| 111 | grange | 2.21 | 182 | cadenas | 0 | 3 | télévision | 2.21 | 62 | tigre | 0 |
| 76 | putois | 2.21 | 193 | ceinture | 0 | 114 | clé à molette | 2.15 | 63 | ours | 0 |
| 1 | chaise | 2.15 | 212 | pomme | 0 | 231 | épingle à linge | 2.09 | 64 | renard | 0 |
| 45 | feu vert | 2.14 | 216 | fraise | 0 | 38 | chandail | 2.05 | 68 | cheval | 0 |
| 75 | léopard | 2.14 | 217 | citron | 0 | 115 | fil | 2.03 | 70 | girafe | 0 |
| 53 | coquillage | 2.10 | 219 | banane | 0 | 184 | chemise | 2.02 | 74 | lion | 0 |
| 184 | veste | 2.04 | 220 | ananas | 0 | 47 | index | 1.85 | 113 | clé | 0 |
| 85 | barrière | 2.00 | 39 | robe | 0.08 | 206 | fusil | 1.84 | 123 | couronne | 0 |
| 115 | fil | 1.92 | 56 | écureuil | 0.08 | 165 | oie | 1.84 | 125 | cigare | 0 |
| 166 | pingouin | 1.92 | 57 | zèbre | 0.08 | 137 | maïs | 1.83 | 130 | fourmi | 0 |
| 22 | cuisinière | 1.91 | 70 | girafe | 0.08 | 110 | lime à ongles | 1.79 | 134 | tomate | 0 |
| 175 | tambour | 1.75 | 92 | nuage | 0.08 | 19 | poêle | 1.77 | 136 | oignon | 0 |
| 172 | aigle | 1.73 | 105 | puits | 0.08 | 95 | pain | 1.75 | 139 | céleri | 0 |
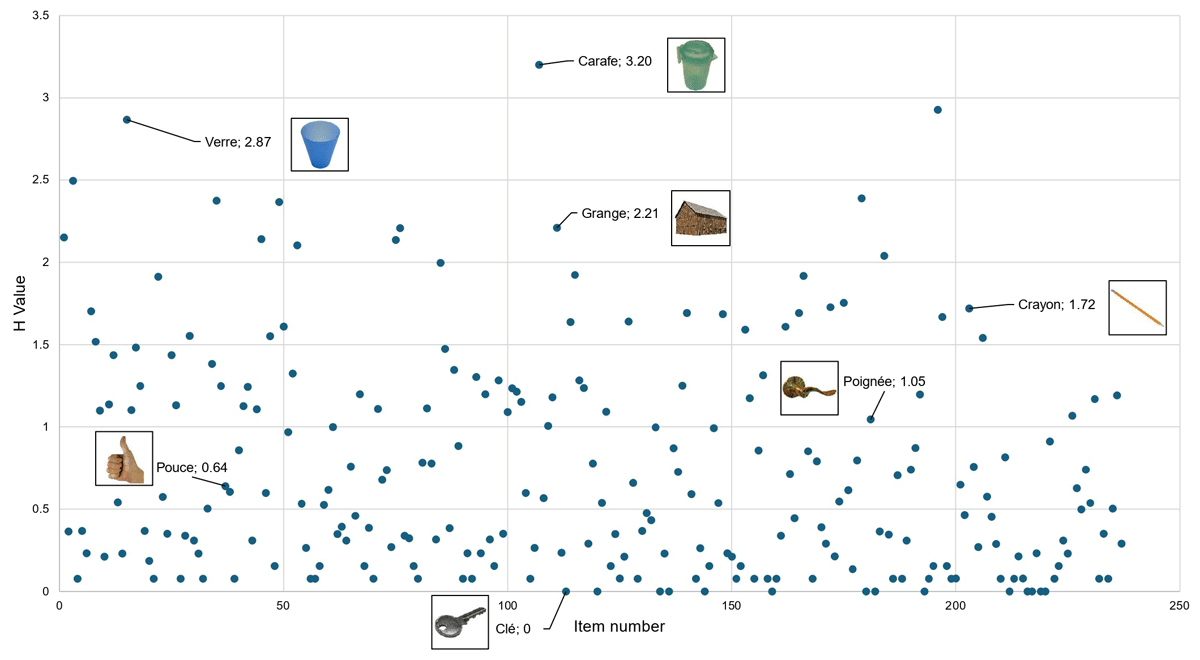
Figure 1
H-values for the 237 photographs in the France French dataset. Each point represents one item, with selected examples annotated using the corresponding photograph, modal name, and H-value.
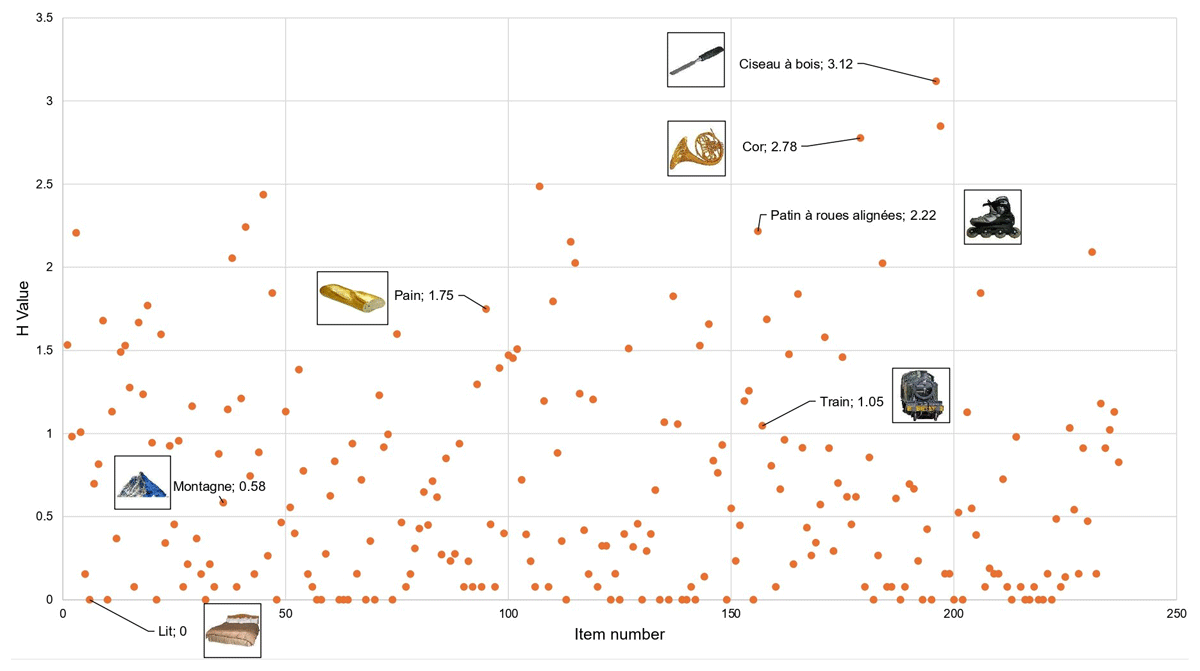
Figure 2
H-values for the 237 photographs in the Quebec French dataset. Each point represents one item, with selected examples annotated using the corresponding photograph, modal name, and H-value.
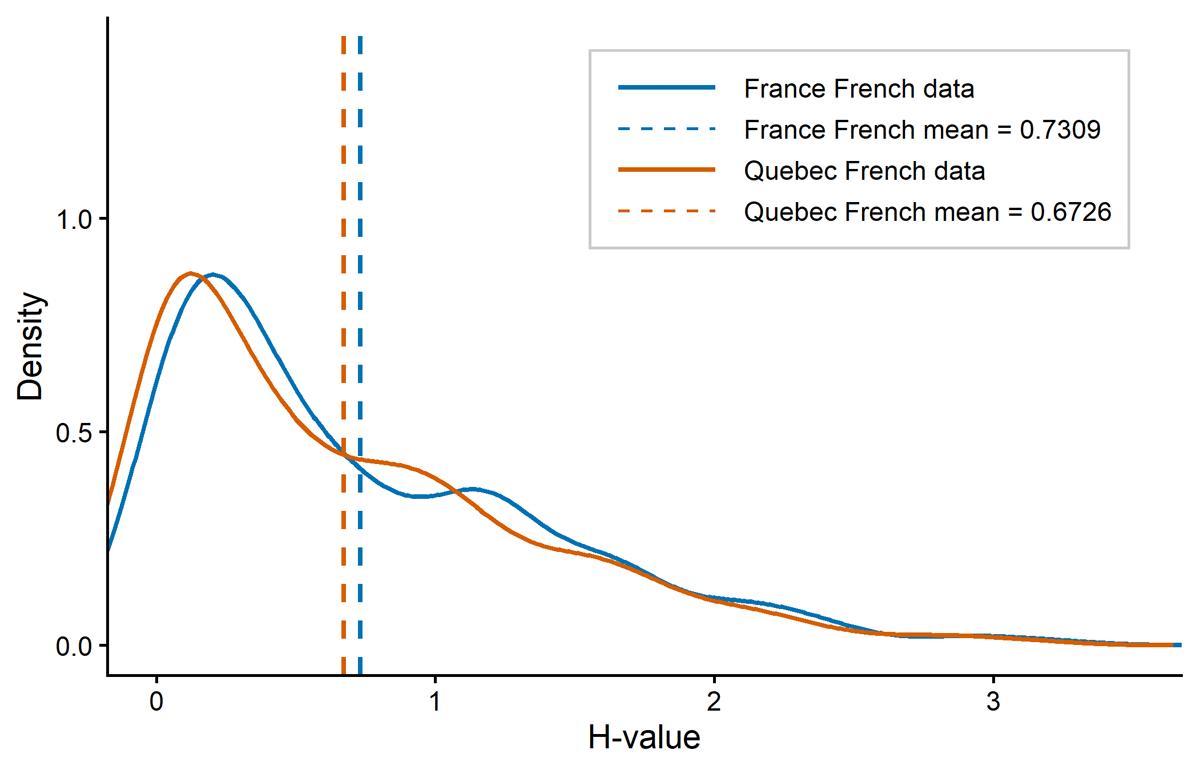
Figure 3
Kernel density estimates of H-value distributions in the France French and Quebec French datasets. Dashed vertical lines indicate the mean H-value for each variety.