
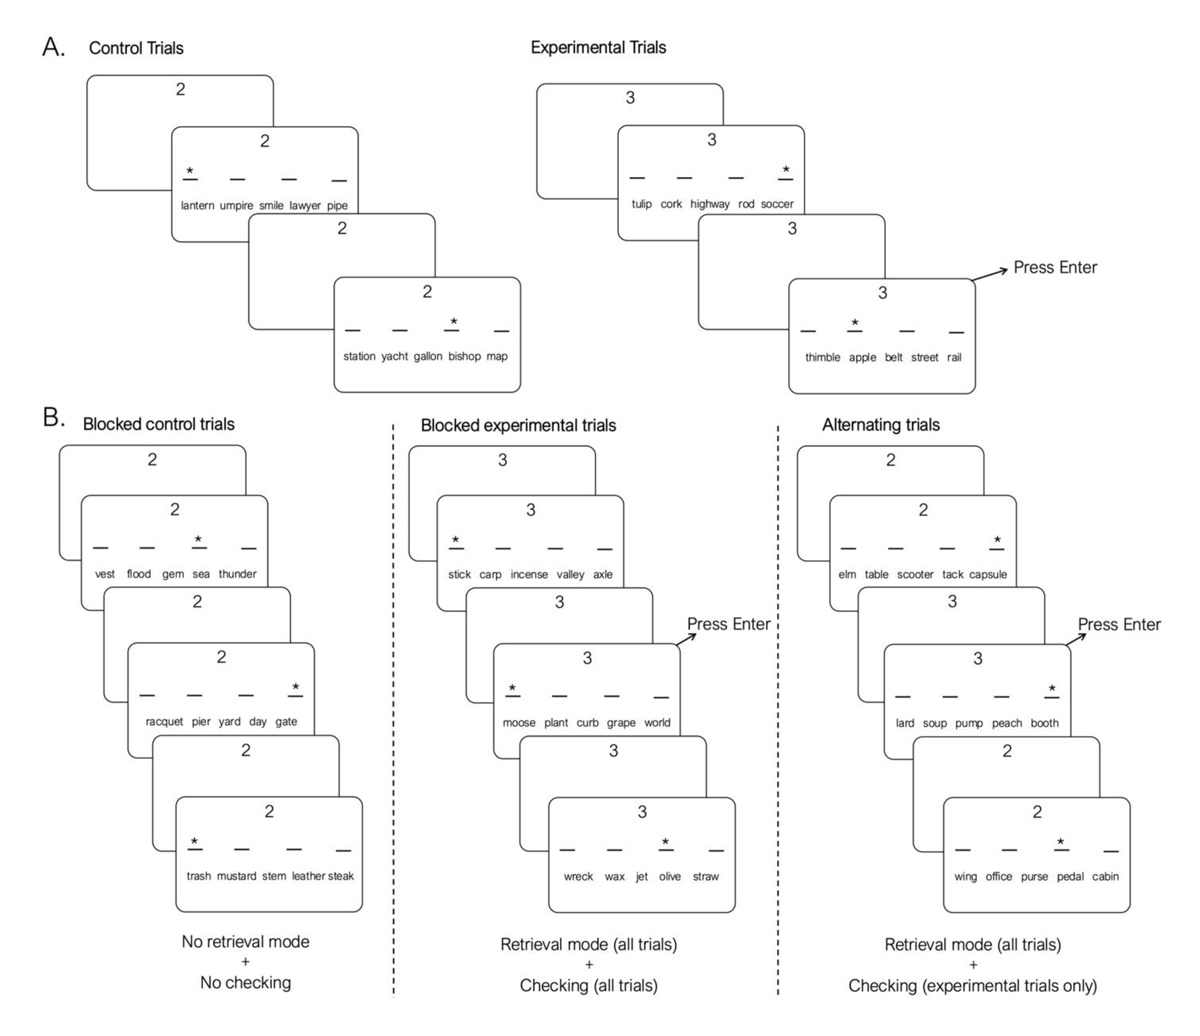
Figure 1
Experimental procedures from Guynn (2003). A. Example control and experimental trials. Participants completed the short-term memory and asterisk tasks together during control trials, which were denoted with a “2” at the top of the screen. Participants performed the short-term memory task, asterisk task, and PM task during experimental trials, which were denoted with a “3” at the top of the screen. For the PM task, participants were instructed to press Enter if a fruit word appeared. B. Example blocked control trials, blocked experimental trials, and alternating trials.
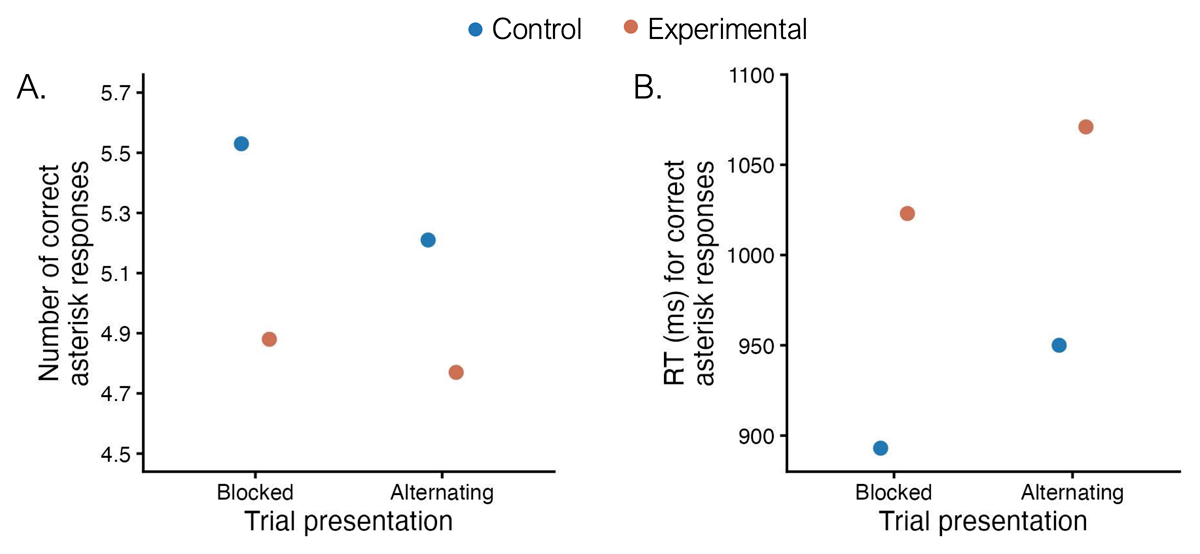
Figure 2
Asterisk task performance results from Guynn (2003). A. Average number of correct asterisk task responses per run during blocked and alternating control and experimental trials. B. Average reaction time on asterisk task during blocked and alternating control and experimental trials. Figure recreated from Guynn (2003).
Table 1
Participant Demographic Information.
| EXPERIMENT 1 | EXPERIMENT 2 | |
|---|---|---|
| N | 136 | 136 |
| Age M (SD) | 19.8 (1.3) | 19.0 (1.2) |
| Gender n (%) | ||
| Female | 97 (71%) | 104 (76%) |
| Male | 39 (29%) | 32 (24%) |
| Race n (%) | ||
| White | 54 (40%) | 60 (44%) |
| Asian | 46 (34%) | 47 (35%) |
| Multi-racial | 16 (12%) | 6 (4%) |
| Black or African American | 11 (8%) | 11 (8%) |
| Hispanic or Latino | 6 (4%) | 7 (5%) |
| American Indian or Alaska Native | 0 (0%) | 1 (1%) |
| Prefer not to answer | 3 (2%) | 4 (3%) |
[i] Note. Age is reported in years.
Table 2
Mean Performance (Standard Deviation) Across Trial Conditions in Experiment 1 and 2.
| EXPERIMENT | DEPENDENT VARIABLE | BLOCKED | ALTERNATING | ||
|---|---|---|---|---|---|
| CONTROL | EXPERIMENTAL | CONTROL | EXPERIMENTAL | ||
| 1 | Asterisk task, proportion correct | .94 (.06) | .94 (.06) | .94 (.06) | .94 (.06) |
| Asterisk task, number correct | 10.2 (2.3) | 9.6 (2.3) | 9.7 (2.2) | 9.4 (2.2) | |
| Asterisk task, reaction time | 694 (153) | 744 (188) | 731 (186) | 756 (188) | |
| Short-term memory task, number correct | 4.2 (.59) | 4.2 (.63) | 4.1 (.61) | 4.1 (.63) | |
| Prospective memory accuracy | — | .84 (.23) | — | .78 (.28) | |
| 2 | LDT, proportion correct | .94 (.05) | .93 (.05) | .94 (.05) | .93 (.05) |
| LDT, reaction time | 625 (101) | 678 (102) | 692 (133) | 696 (123) | |
| Prospective memory accuracy | — | .61 (.31) | — | .60 (.32) | |
[i] Note. Asterisk task reaction time is reported in milliseconds. The number correct on the short-term memory task reflects the number of correctly recalled words per trial, with a maximum possible score of five (i.e., the number of words presented on each trial). Prospective memory accuracy is not reported for control trials, as no PM targets appeared on these trials.
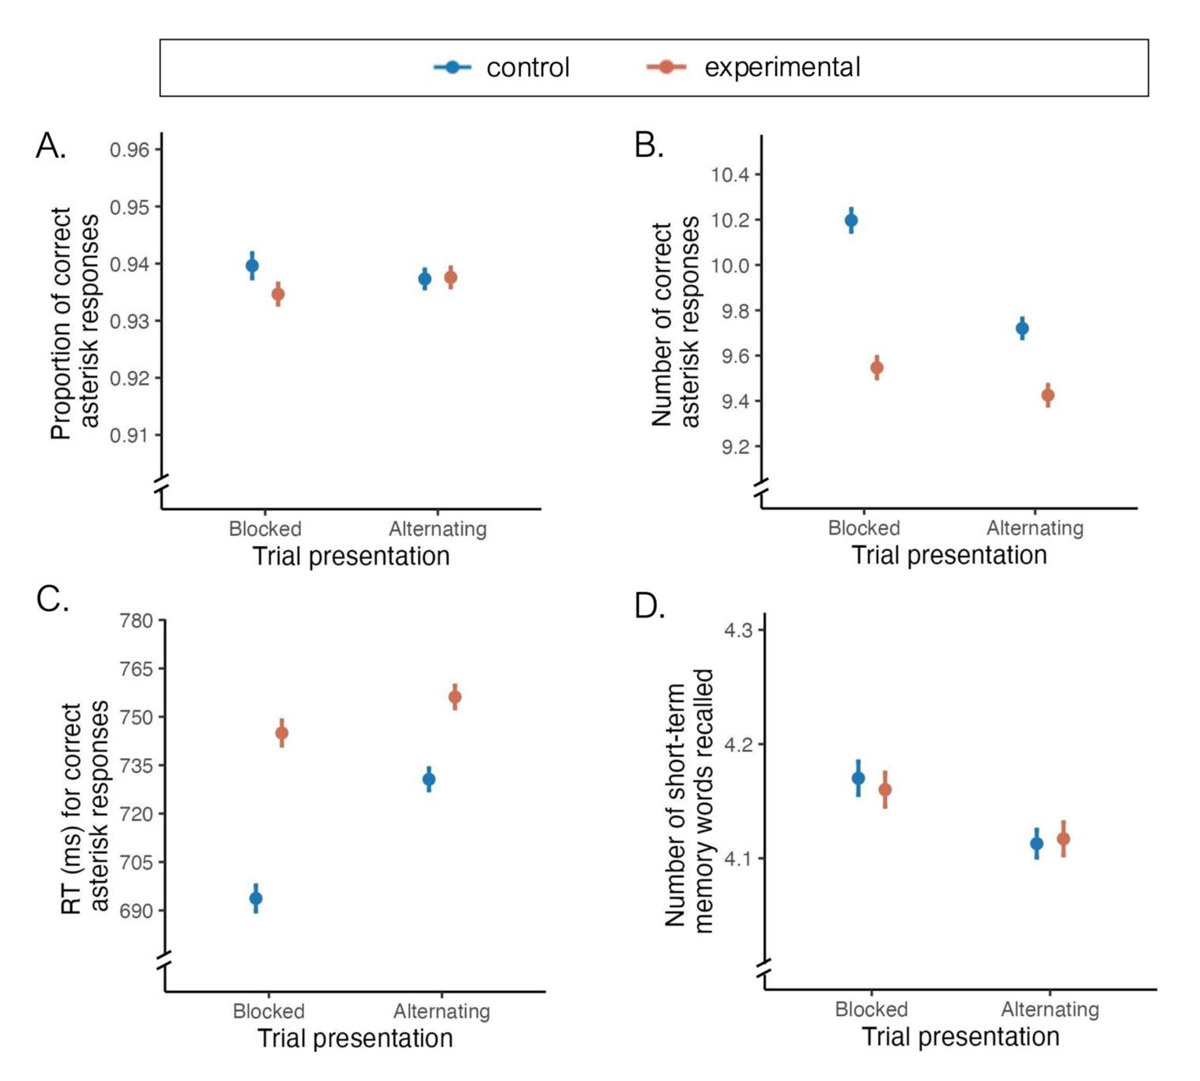
Figure 3
Ongoing asterisk and short-term memory task performance during Experiment 1. A. The mean proportion of correct asterisk presses. Larger proportions indicate better performance. B. The average number of correct asterisk responses. Means were calculated based on the number of correct asterisk responses made during a single short-term memory trial, and larger numbers indicate better performance. C. Mean reaction time for correct asterisk responses. Lower numbers indicate faster responding and thus better performance. D. Average number of words recalled on each short-term memory trial. All error bars represent the within-participant standard error.
Table 3
Analyses of Variance Results from Experiment 1 and 2.
| EXPERIMENT | DEPENDENT VARIABLE | EFFECT | F | df | P | ηP2 |
|---|---|---|---|---|---|---|
| 1 | Asterisk task, proportion correct | Trial type | 1.05 | 1,135 | .308 | .01 |
| Trial presentation | .20 | 1,135 | .653 | <.01 | ||
| Trial type × Trial presentation | 2.11 | 1,135 | .149 | .02 | ||
| Asterisk task, number correct | Trial type* | 92.34 | 1,135 | <.001 | .41 | |
| Trial presentation* | 19.31 | 1,135 | <.001 | .13 | ||
| Trial type × Trial presentation* | 19.32 | 1,135 | <.001 | .13 | ||
| Asterisk task, reaction time | Trial type* | 92.65 | 1,135 | <.001 | .41 | |
| Trial presentation* | 21.25 | 1,135 | <.001 | .14 | ||
| Trial type × Trial presentation* | 13.33 | 1,135 | <.001 | .09 | ||
| Short term memory task, number correct | Trial type | .06 | 1,135 | .860 | <.01 | |
| Trial presentation* | 8.34 | 1,135 | .005 | .06 | ||
| Trial type × Trial presentation | .23 | 1,135 | .636 | <.01 | ||
| 2 | LDT, proportion correct | Trial type* | 13.39 | 1,135 | <.001 | .09 |
| Trial presentation | .88 | 1,135 | .351 | .01 | ||
| Trial type × Trial presentation | .01 | 1,135 | .754 | <.01 | ||
| LDT, reaction time | Trial type* | 90.12 | 1,135 | <.001 | .40 | |
| Trial presentation* | 27.52 | 1,135 | <.001 | .17 | ||
| Trial type × Trial presentation* | 44.59 | 1,135 | <.001 | .25 |
[i] Note. All analyses of variance were 2 (trial type) × 2 (trial presentation) repeated-measures ANOVAs. * denotes a significant effect.
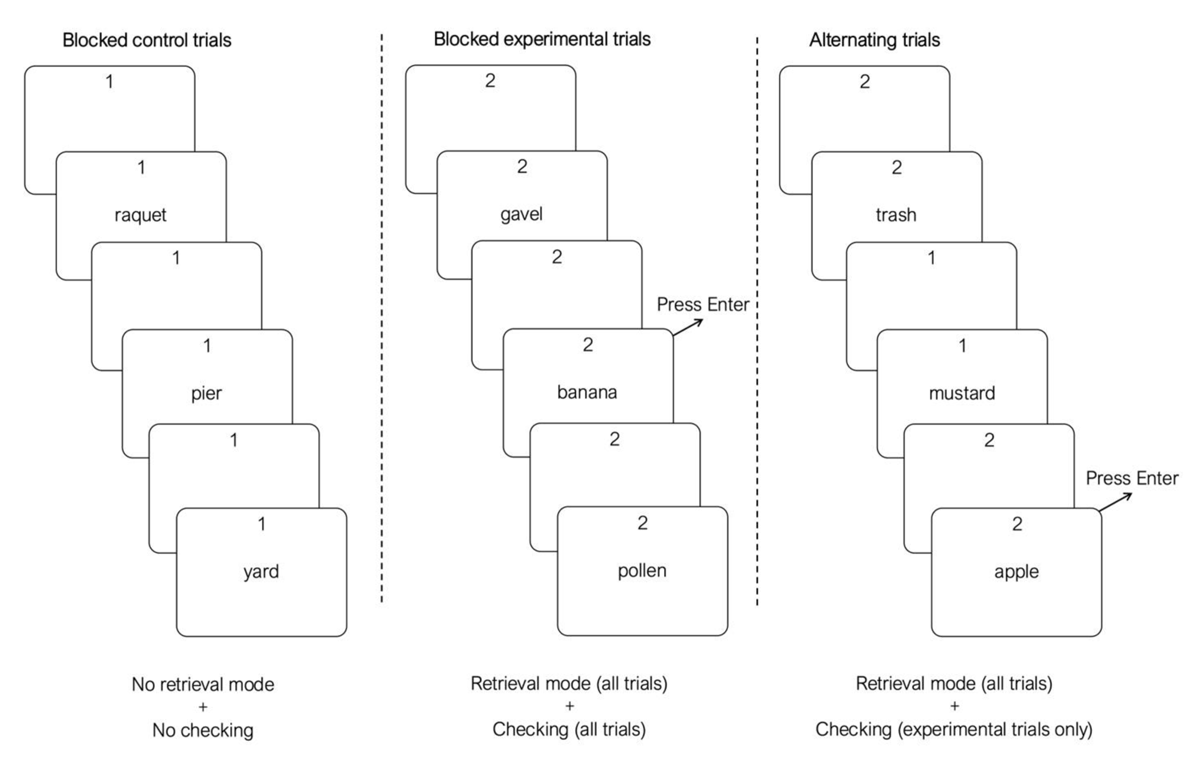
Figure 4
Experiment 2 procedures. Example blocked control trials (leftmost panel), blocked experimental trials (middle panel), and alternating blocked and experimental trials (rightmost panel). During blocked control trials, denoted with a “1” at the top of the screen, participants performed the LDT only. During blocked experimental trials, denoted with a “2” at the top of the screen, participants completed the LDT and PM tasks concurrently. During alternating trials, participants alternated between performing the LDT only (i.e., control trials) and performing the LDT with the PM task (i.e., experimental trials).
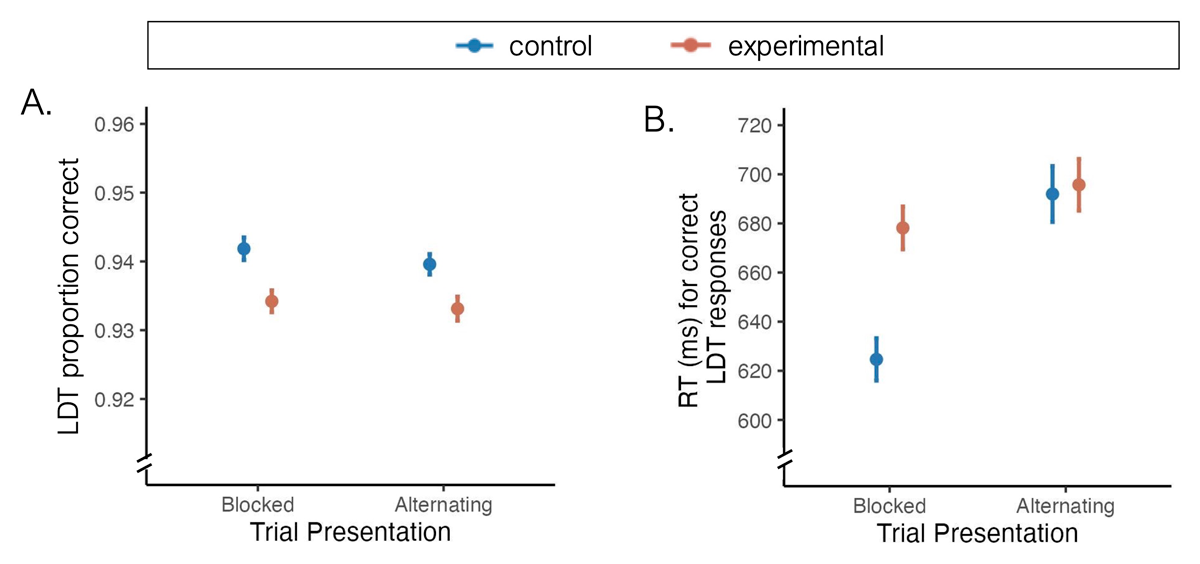
Figure 5
Ongoing LDT performance during Experiment 2. A. Proportion of correct LDT trials during each trial type and trial presentation. Larger numbers represent better performance. B. Mean reaction time for correct LDT responses. Lower numbers represent better performance. All error bars represent within-subject standard errors.