
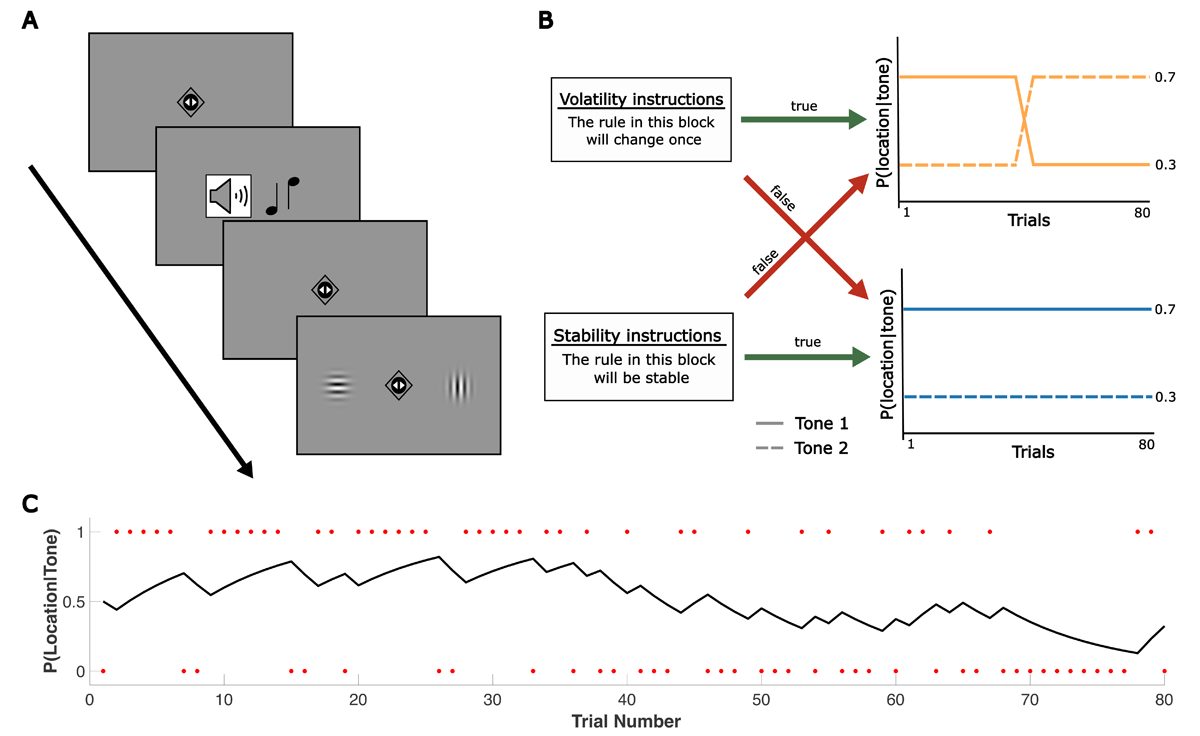
Figure 1
Overview of experimental setup and modelling approach. (A) General trial sequence for both tasks. Whereas two triangles were shown inside the fixation diamond in the predictive task, two small circles were depicted at fixation in the reactive task to avoid confusion of the two different response requirements. A high or low tone predicted the target’s left or right location with a certain probability. Participants were asked to indicate the target’s location after its appearance (reactive task) or to predict the target’s location before it appeared (predictive task). (B) Overview of the experimental conditions. Participants completed four blocks per task. Blocks were either reversal or stable blocks (i.e., involved a reversal of cue-target contingencies or not). At the beginning of each block, true or false instructions about the volatility of the block were presented. (C) Example of the output from the learning model, showing a participant’s estimated probability of tone 1 leading to target location 1 across trials of a reversal block. Red dots indicate the trial-wise outcome ut, coded relative to the cue-target contingency in the first half of the block: ut = 1 if the outcome matched this initial contingency, and ut = 0 if the outcome did not match the initial contingency. Further examples of trajectories per block type are provided in Supplementary Figure S1.
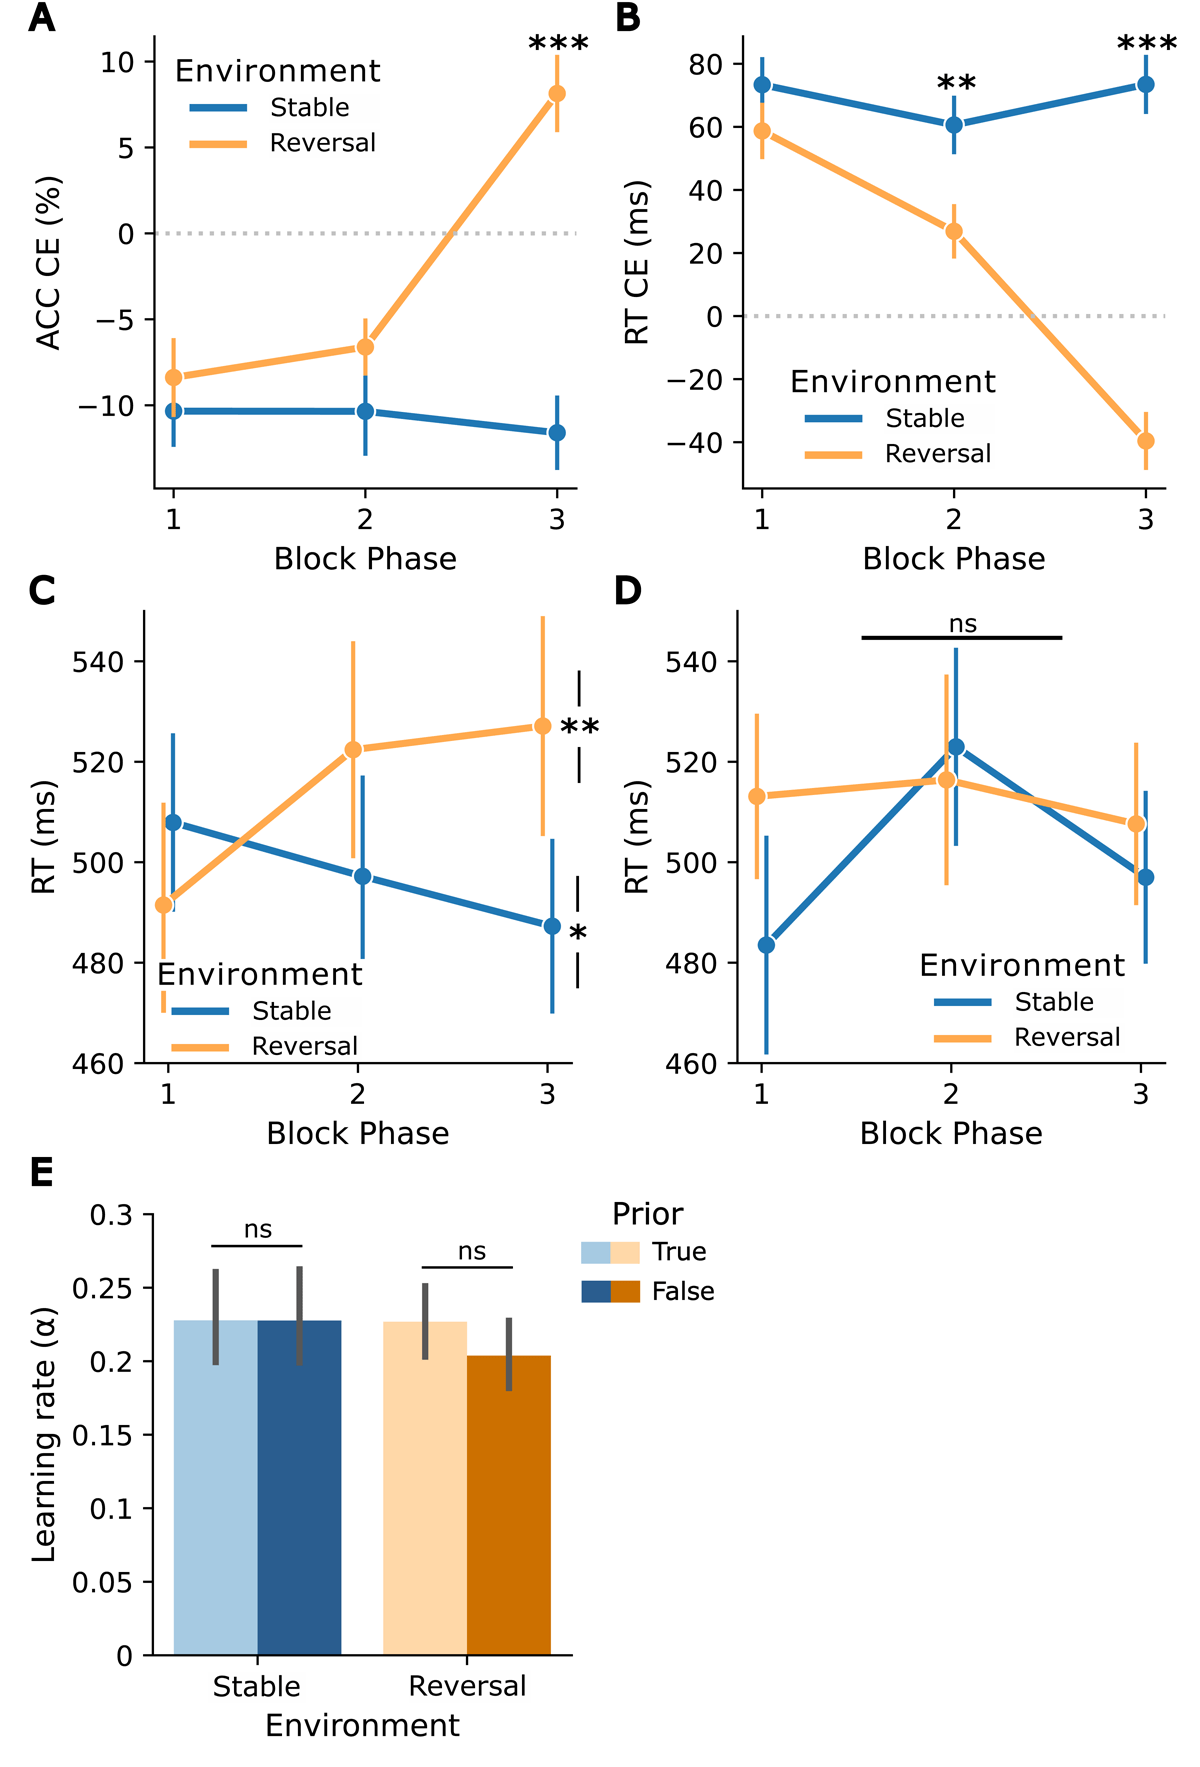
Figure 2
Adaptation to cue-target contingencies and their changes, in relation to prior volatility beliefs in the reactive task. Block phase x environment interaction for cueing effects (CEs): (A) Accuracy CEs (ACC unexpected – ACC expected, based on the contingency in the first half), (B) RT CEs (RT unexpected – RT expected, based on the contingency in the first half), both reflecting adaptation to the reversal in cue-target contingency in reversal blocks. (C) Post-hoc analysis: more frequent/expected trial RTs after a trial that does not match the cue-target contingency for true priors. Asterisks indicate a difference between the first and last block phases in each environment. (D) Post-hoc analysis: more frequent/expected trial RTs after a trial that does not match the cue-target contingency for false priors. (E) Learning rate α for both environments (stable, reversal) and priors (true, false). Asterisks indicate significance levels: p < 0.05 (*), p < 0.01 (**), p < 0.001 (***). Error bars reflect standard errors of the mean (SEM).
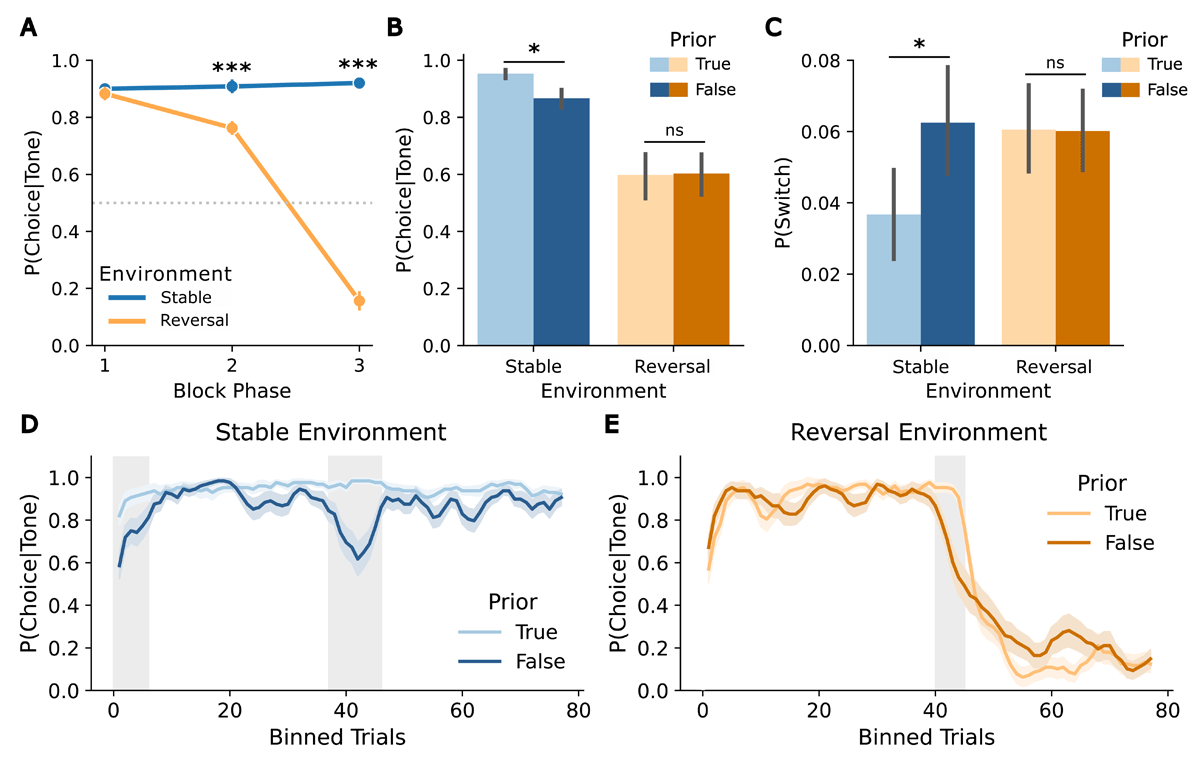
Figure 3
Adaptation to changes in cue-target contingencies and influence of prior volatility beliefs on model-free measures in the predictive task. (A) Participants’ choice accuracy across block phases in both environments (stable, reversal) demonstrates adaptation to the cue-target contingency. (B) Choice accuracy by environment (stable, reversal) and prior (true, false). (C) Probability of switching by environment (stable, reversal) and prior (true, false). (D) Choice accuracy in the stable environment, averaged using a sliding window (n = 4) separated by prior (true, false). (E) Choice accuracy in the reversal environment, averaged using a sliding window (n = 4) separated by prior (true, false). Asterisks indicate significance levels: p < 0.05 (*), p < 0.01 (**), p < 0.001 (***). Error bars reflect SEMs.
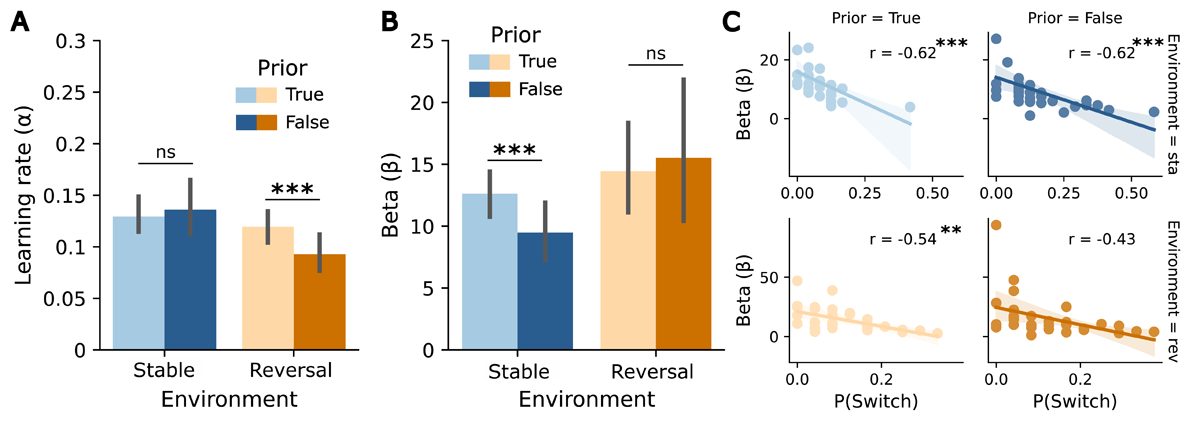
Figure 4
Influence of the prior volatility belief on the RW model parameters in the predictive task. (A) Learning rate α for both environments (stable, reversal) and priors (true, false). (B) β-values for both environments (stable, reversal) and priors (true, false). (C) Correlation plots between probability of switching and β-values by environment (stable, reversal) and prior (true, false). Asterisks indicate significance levels: p < 0.05 (*), p < 0.01 (**), p < 0.001 (***). Error bars reflect SEMs.
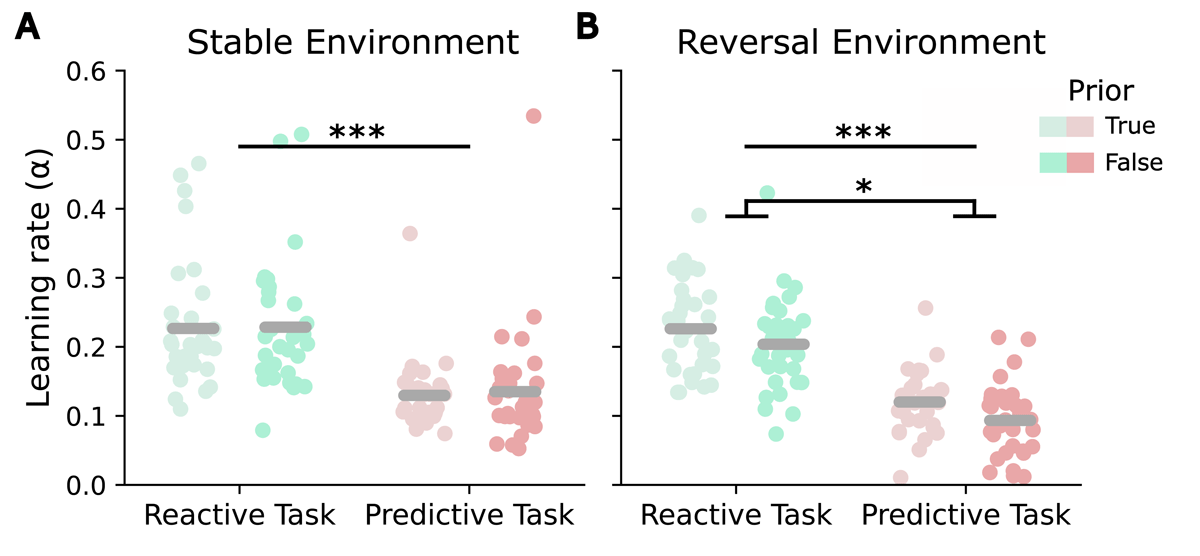
Figure 5
Learning rates in the reactive as compared to the predictive task. (A) Learning rates α for true and false priors per task in a stable environment. (B) Learning rates α for true and false priors per task in a reversal environment. Asterisks indicate significance levels: p < 0.05 (*), p < 0.01 (**), p < 0.001 (***).