
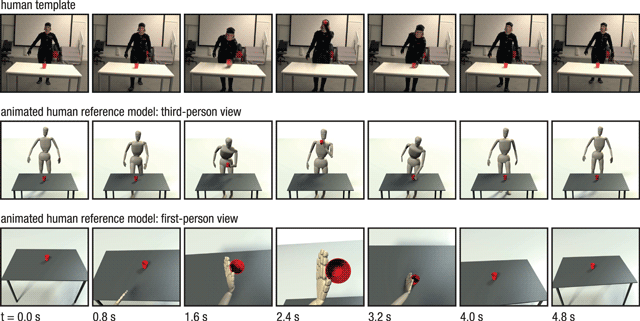
Figure 1
Exemplary depiction of the action drink in the short video condition. Animated videos were obtained from videos of an actress doing the same everyday actions with real objects and wearing a motion capture suit (top). The two bottom panels show the animated human reference model as seen from third- (middle) and first-person perspective (bottom) based on the human template video.
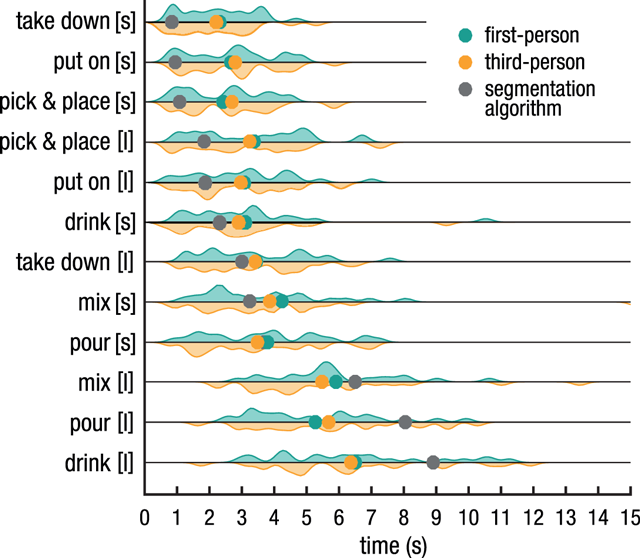
Figure 2
Estimated action durations. Coloured dots indicate mean reproduced durations for each action (short indicated with [s], long with [l]), averaged over all participants. Violin plots illustrate the density distributions of participants’ reproduced action durations. Grey dots depict the objective duration as defined by the action segmentation algorithm. Generally, shorter durations were overestimated and longer durations underestimated, demonstrating typical context effects.
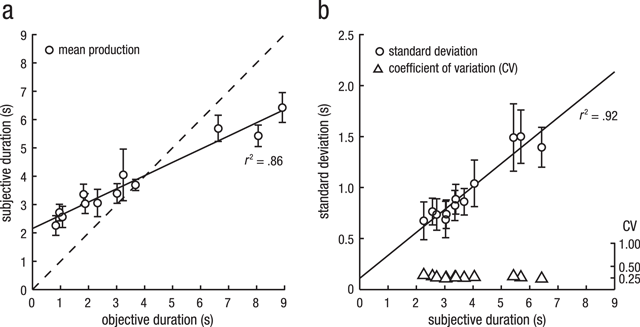
Figure 3
Estimated action durations (a) and variance associated with estimated durations (b) for the short and long version of the 6 different actions. Panel A depicts mean reproduced durations (error bars indicate the 95% CI, corrected for between-subject variability), averaged over all participants and first-/third-person perspective trials, plotted against the objective duration. Reproduced durations differ from the objective durations (diagonal dashed line): shorter durations were overestimated, whereas longer durations were underestimated, demonstrating context effects. Panel B depicts the standard deviation over subjective duration for all 12 actions. Conforming to the scalar property, regression of mean standard deviation (error bars indicate the 95% CI, corrected for between-subject variability) against mean reproduced duration (circles) revealed a linear relationship (solid line) with r2 = .92. Calculated coefficients of variation (triangles) did not differ significantly from each other.