
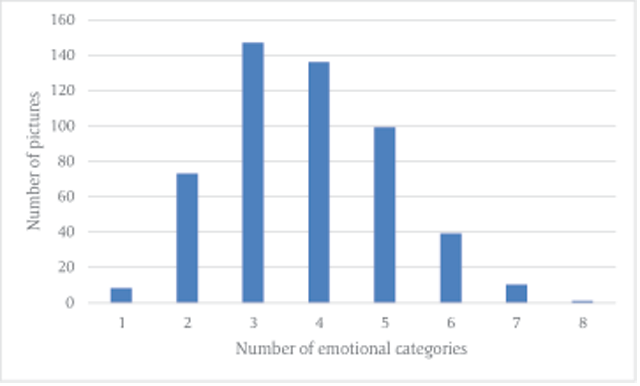
Figure 1
Distribution of frequencies of the number of emotional categories provided to describe pictures.
Table 1
Frequency of the emotional categories.
| Emotional category | Image | General | Number of words |
|---|---|---|---|
| Anger | 26 | 148 | 2 |
| Compassion | 62 | 217 | 2 |
| Disgust | 73 | 209 | 3 |
| Fear | 76 | 301 | 6 |
| Guilt | 0 | 0 | 1 |
| Happiness | 107 | 204 | 4 |
| Hate | 0 | 16 | 3 |
| Hope | 0 | 70 | 3 |
| Jealousy | 0 | 41 | 1 |
| Love | 16 | 152 | 3 |
| Peacefulness | 24 | 111 | 3 |
| Pride | 2 | 47 | 1 |
| Regret | 0 | 4 | 1 |
| Sadness | 63 | 234 | 7 |
| Shame | 0 | 23 | 2 |
| Surprise | 4 | 160 | 5 |
[i] Note. Image – the number of pictures in which the specific category was the most frequent. General – the number of times the category was provided by the psychologists. Number of words – How many words were used to describe the emotional category.
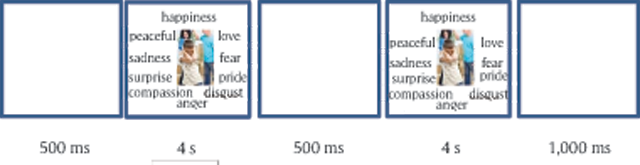
Figure 2
An example trial from Experiment 1.
Table 2
Correlations between parameters from the pre-testing phase and agreement levels from Experiment 1.
| Number of words | Number of categories | Number of emotional categories | Agreement levels psychologists | |
|---|---|---|---|---|
| Agreement levels Exp. 1a | –0.43** | –0.34*** | –0.38** | 0.44** |
| Agreement levels Exp. 1b | –0.44** | –0.35*** | –0.39** | 0.45** |
[i] Note. ** p < 0.01, *** p < 0.001.
Table 3
Distribution of pictures to emotional categories in Exp. 1a.
| Emotional category | Number of pictures (% of 513 pictures) | Number of pictures with an additional category (% of pictures in the category) |
|---|---|---|
| Anger | 20 (0.03) | 14 (0.7) |
| Compassion | 20 (0.03) | 19 (0.95) |
| Disgust | 89 (0.17) | 32 (0.37) |
| Fear | 90 (0.17) | 56 (0.62) |
| Happiness | 112 (0.21) | 47 (0.41) |
| Love | 22 (0.04) | 16 (0.72) |
| Peacefulness | 55 (0.1) | 28 (0.5) |
| Pride | 17 (0.03) | 9 (0.52) |
| Sadness | 86 (0.16) | 61 (0.7) |
| Surprise | 2 (0.003) | 0 (0) |
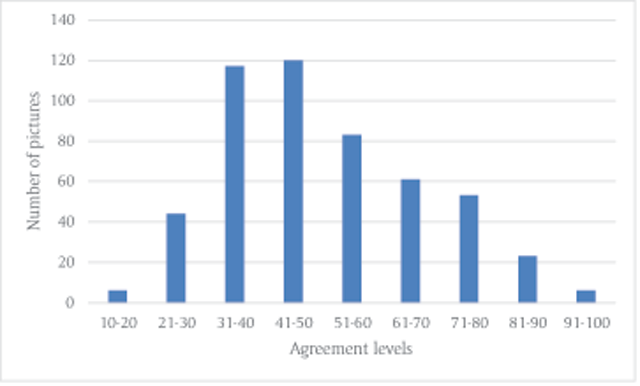
Figure 3
Distribution of number of pictures according to agreement levels in Experiment 1a.
Table 4
Distribution of pictures to emotional categories in Exp. 1b.
| Emotional category | Number of pictures (% of 513 pictures) | Number of pictures with an additional category (% of pictures in the category) |
|---|---|---|
| Anger | 25 (0.04) | 14 (56) |
| Compassion | 13 (0.02) | 11 (0.84) |
| Disgust | 88 (0.16) | 29 (0.32) |
| Fear | 95 (0.18) | 61 (0.64) |
| Happiness | 114 (0.21) | 42 (0.36) |
| Love | 22 (0.04) | 16 (0.72) |
| Peacefulness | 56 (0.1) | 26 (0.46) |
| Pride | 15 (0.02) | 6 (0.4) |
| Sadness | 97 (0.18) | 62 (0.63) |
| Surprise | 1 (0.001) | 0 (0) |
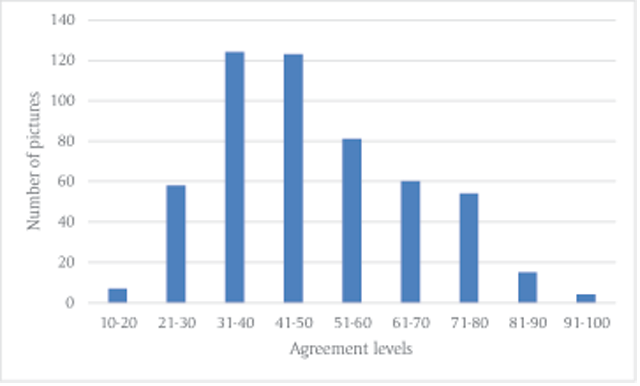
Figure 4
Distribution of number of pictures according to agreement levels in Experiment 1b.