
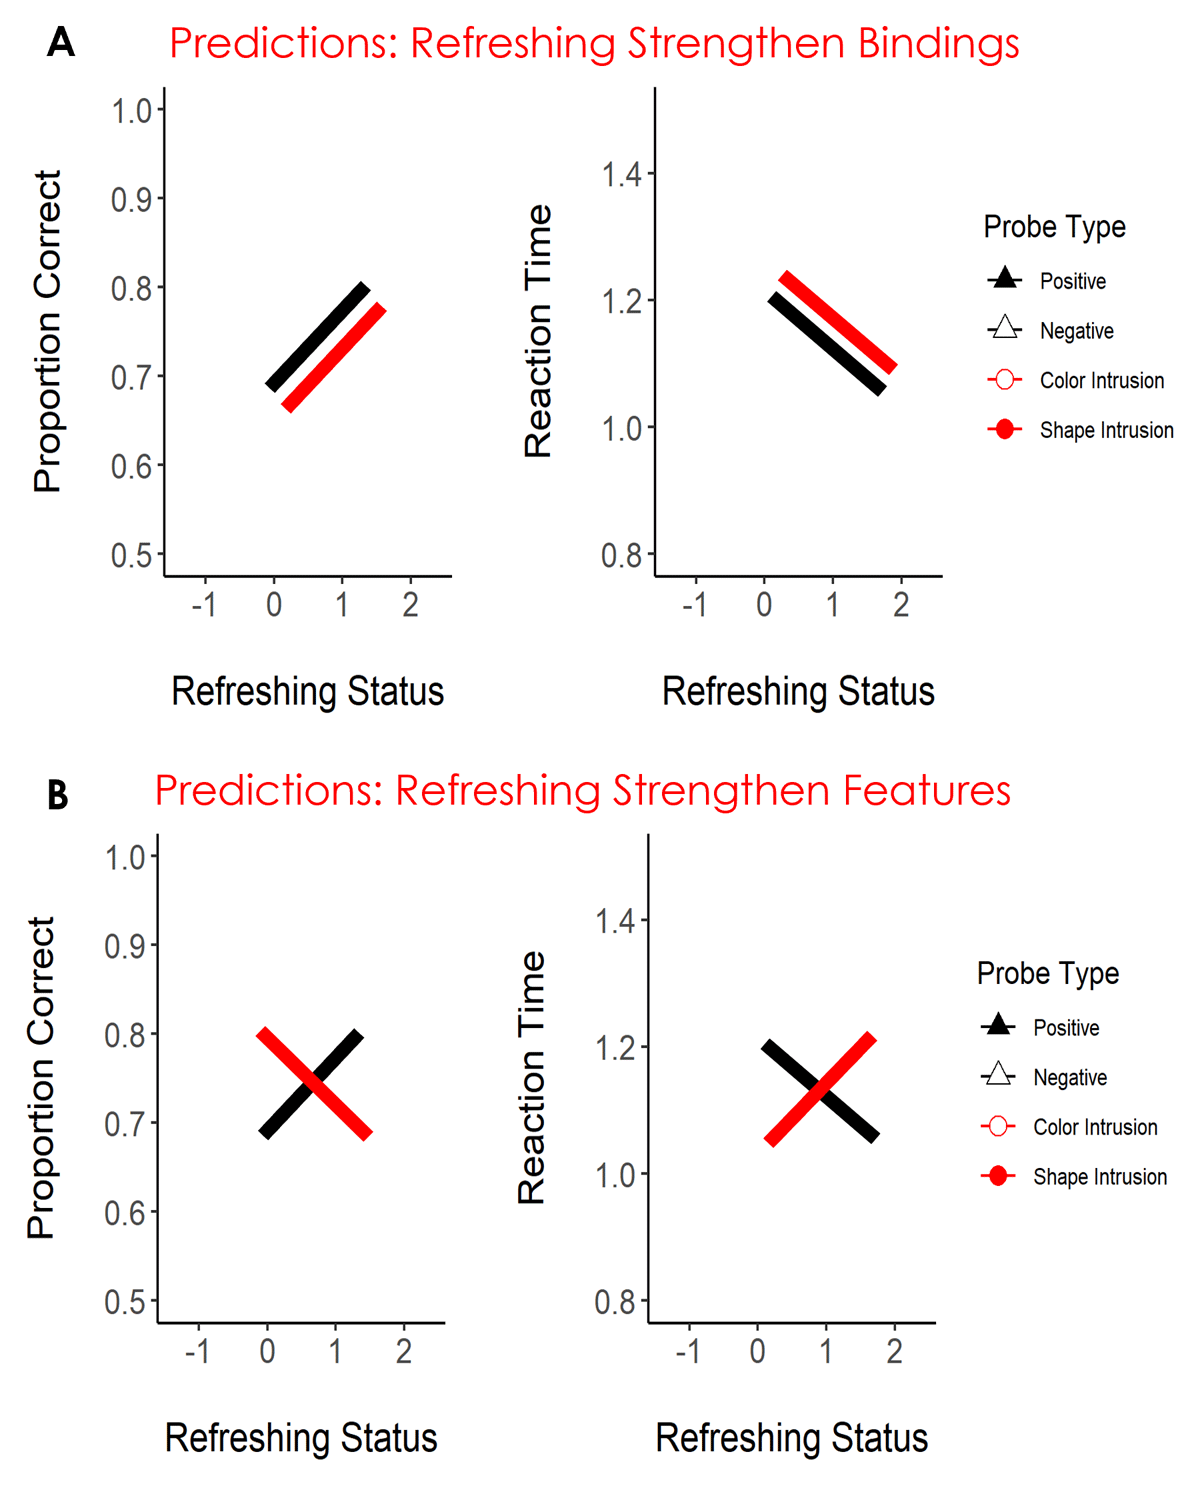
Figure 1
Predictions of Strengthening of Bindings (Panel A) and Strengthening of Individual Features (Panel B) for Accuracy and Reaction Time in Experiments 1 and 2.
Note. The black line represents positive probes and the red line the intrusion probes. We had no expectation of a difference between color and shape intrusions, hence we depicted intrusion probes with a single line. Negative probes are uninformative for distinguishing these hypotheses and hence they were omitted from the illustration.
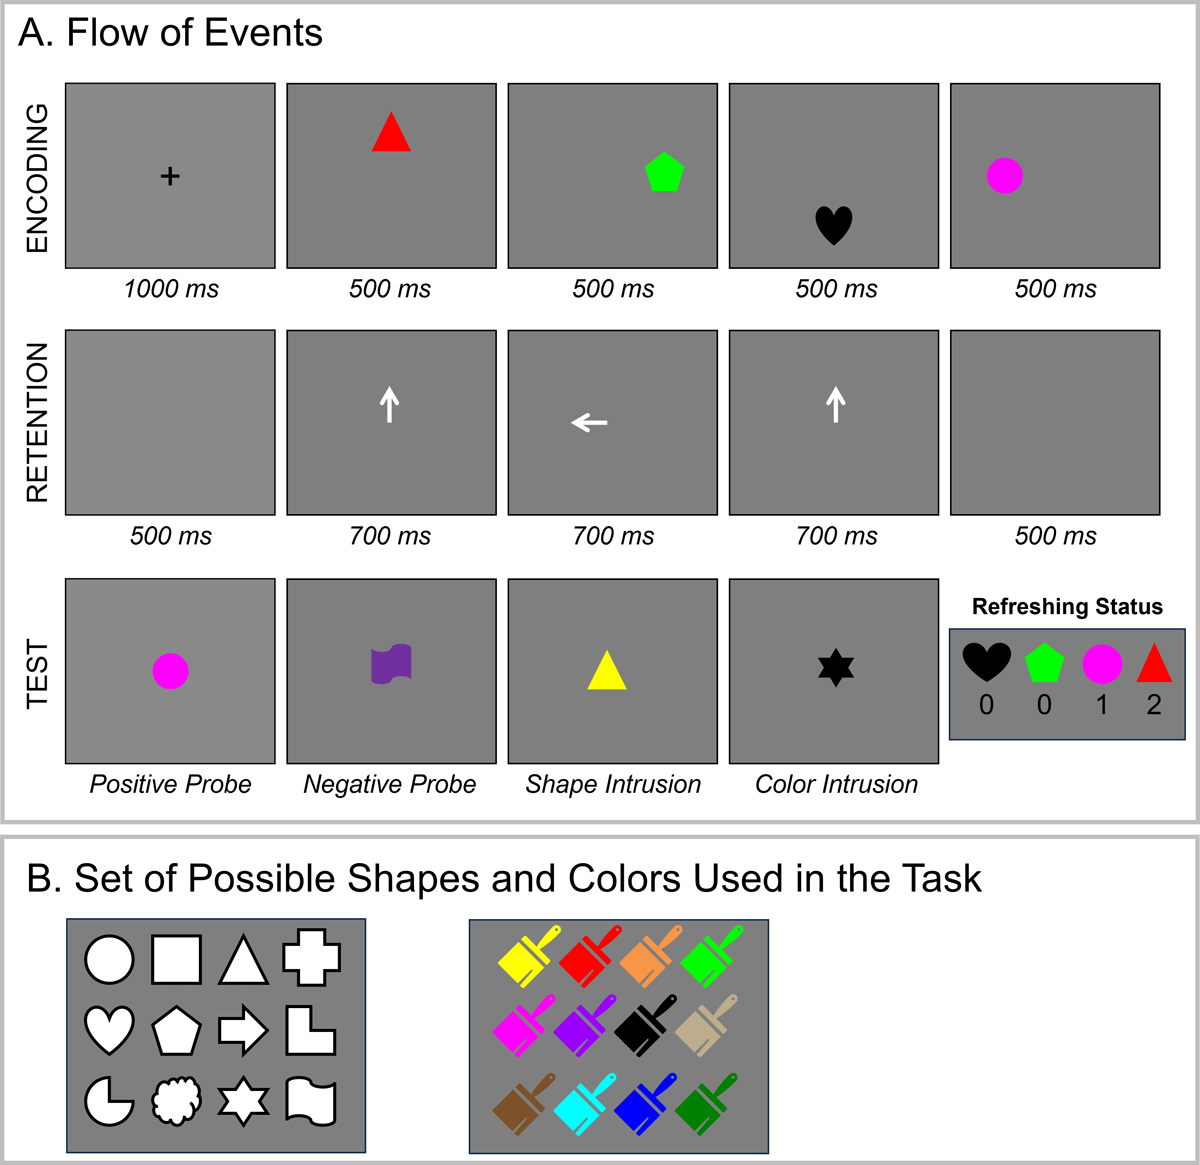
Figure 2
Illustration of the Experimental Procedure (Panel A) and Set of Possible Stimuli (Panel B) in Experiment 1.
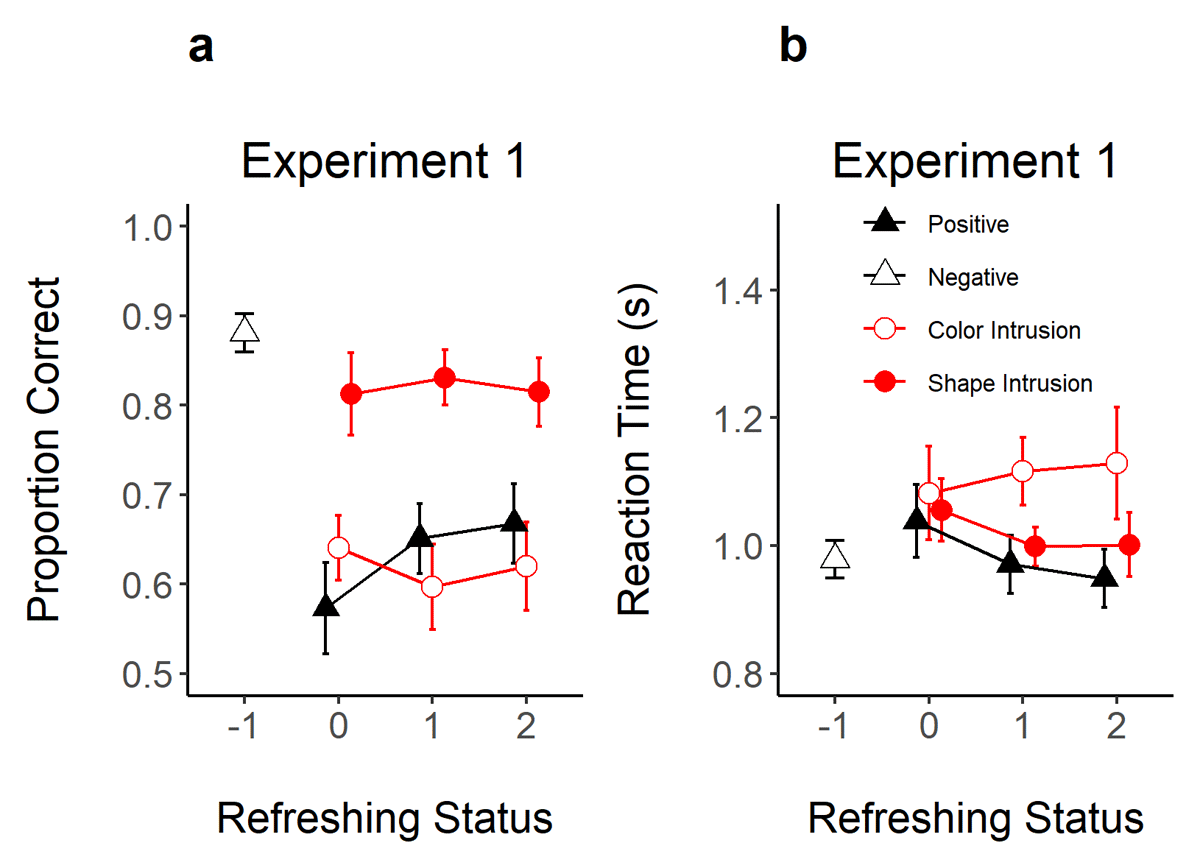
Figure 3
Proportion of Correct Responses (Panel A) and Reaction Time (Panel B) in Experiment 1 as a Function of Refreshing Status (x-axis) and Probe Type (Different Shapes).
Note. Error bars represent 95% within-subjects confidence intervals.
Table 1
Evidence (BF10) for the Effect of Refreshing Status on the Proportion of Correct Responses and RTs for Each Probe Type in Experiments 1 and 2, and for the Pairwise Contrast of Refreshing Levels Within Positive Probes.
| PROPORTION CORRECT | RTs | |||
|---|---|---|---|---|
| E1 | E2 | E1 | E2 | |
| Probe Type | ||||
| Positive | 76.5 (±0.63%) | 12949 (±0.93%) | 3.36 (±0.51%) | 20.10 (±0.33%) |
| Color Intrusion | 0.32 (±0.72%) | 0.05 (±0.77%) | 0.14 (±0.70%) | 0.05 (±0.22%) |
| Shape Intrusion | 0.15 (±0.67%) | 0.06 (±0.92%) | 0.64 (±0.63%) | 0.15 (±0.35%) |
| Contrast of Refreshing Levels within Positive Probes | ||||
| 0 vs. 1 | 5.89 | 31.18 | 1.08 | 0.19 |
| 0 vs. 2 | 22.13 | 3125 | 6.12 | 12.25 |
| 1 vs. 2 | 0.32 | 1.28 | 0.27 | 7.06 |
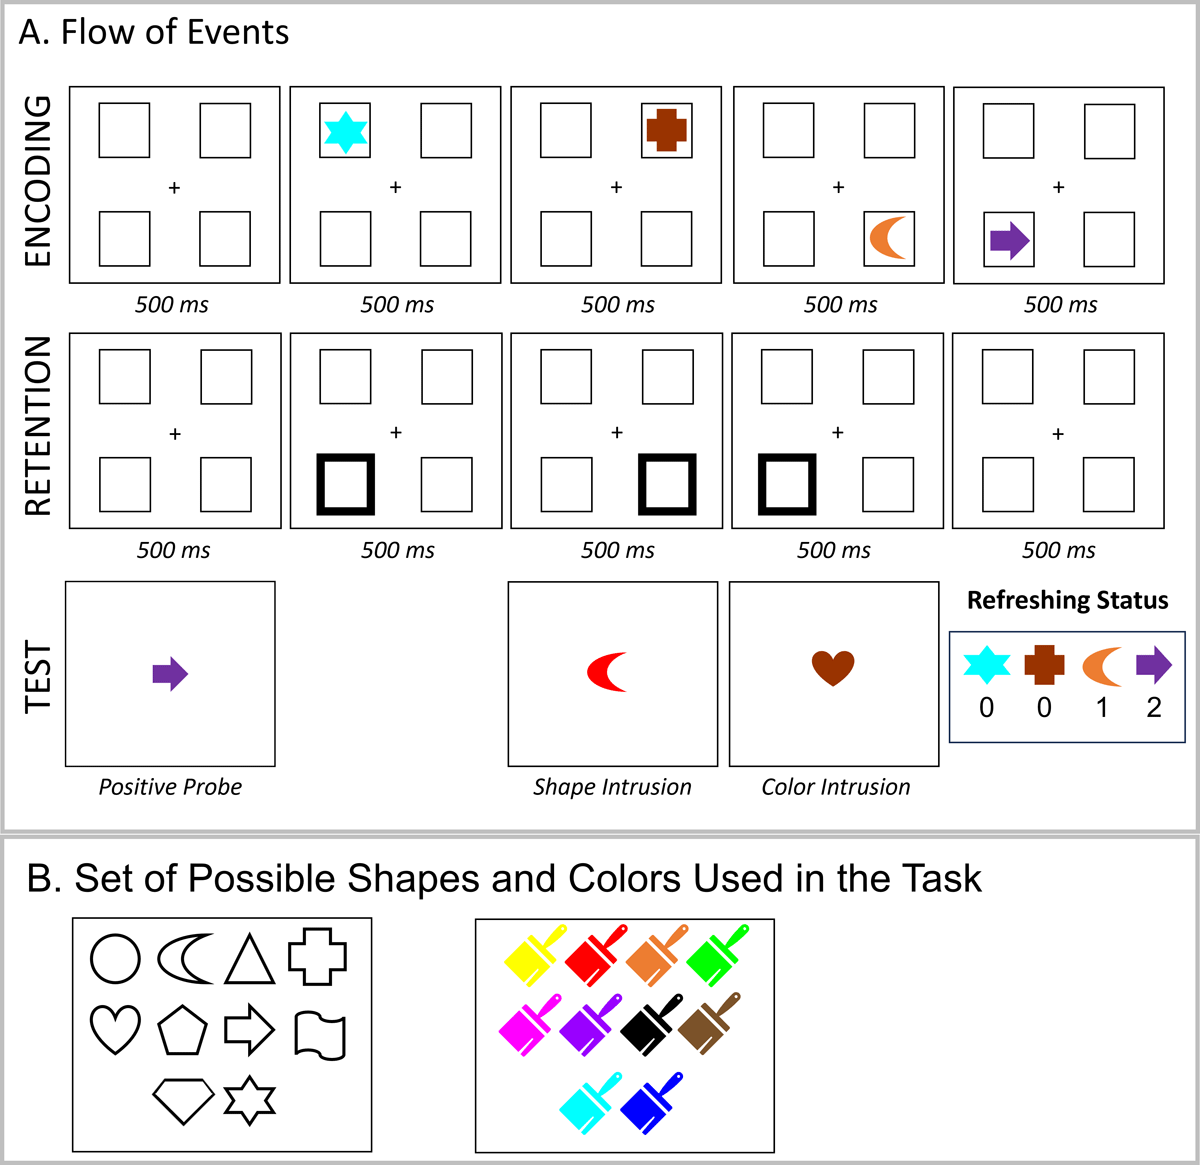
Figure 4
Illustration of the Experimental Procedure (Panel A) and Set of Possible Stimuli (Panel B) in Experiment 2.
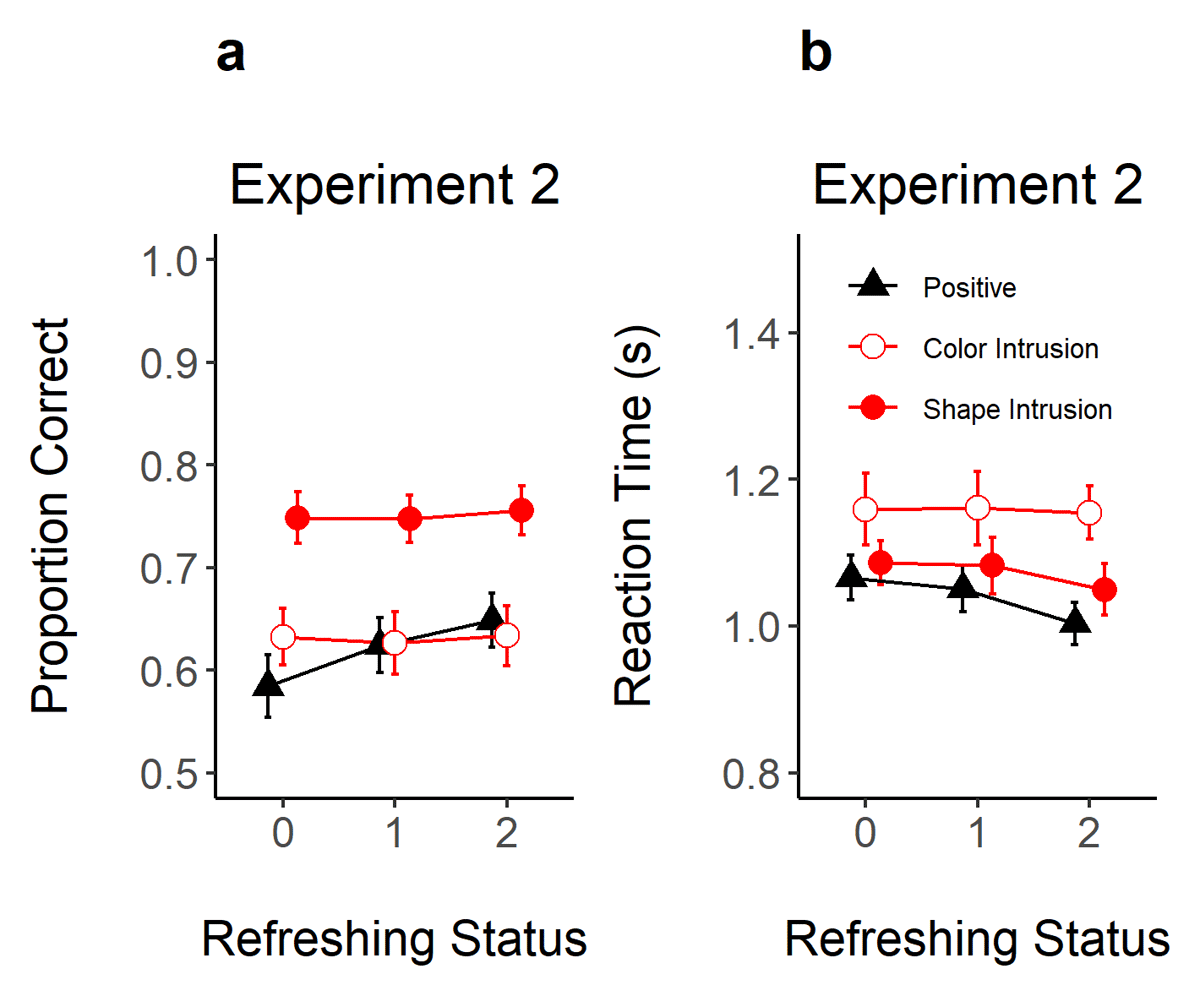
Figure 5
Proportion of Correct Responses (Panel A) and Reaction Time (Panel B) in Experiment 2 as a Function of Refreshing Status (x-axis) and Probe Type (Different Shapes).
Note. Error-bars represent 95% within-subject confidence intervals.
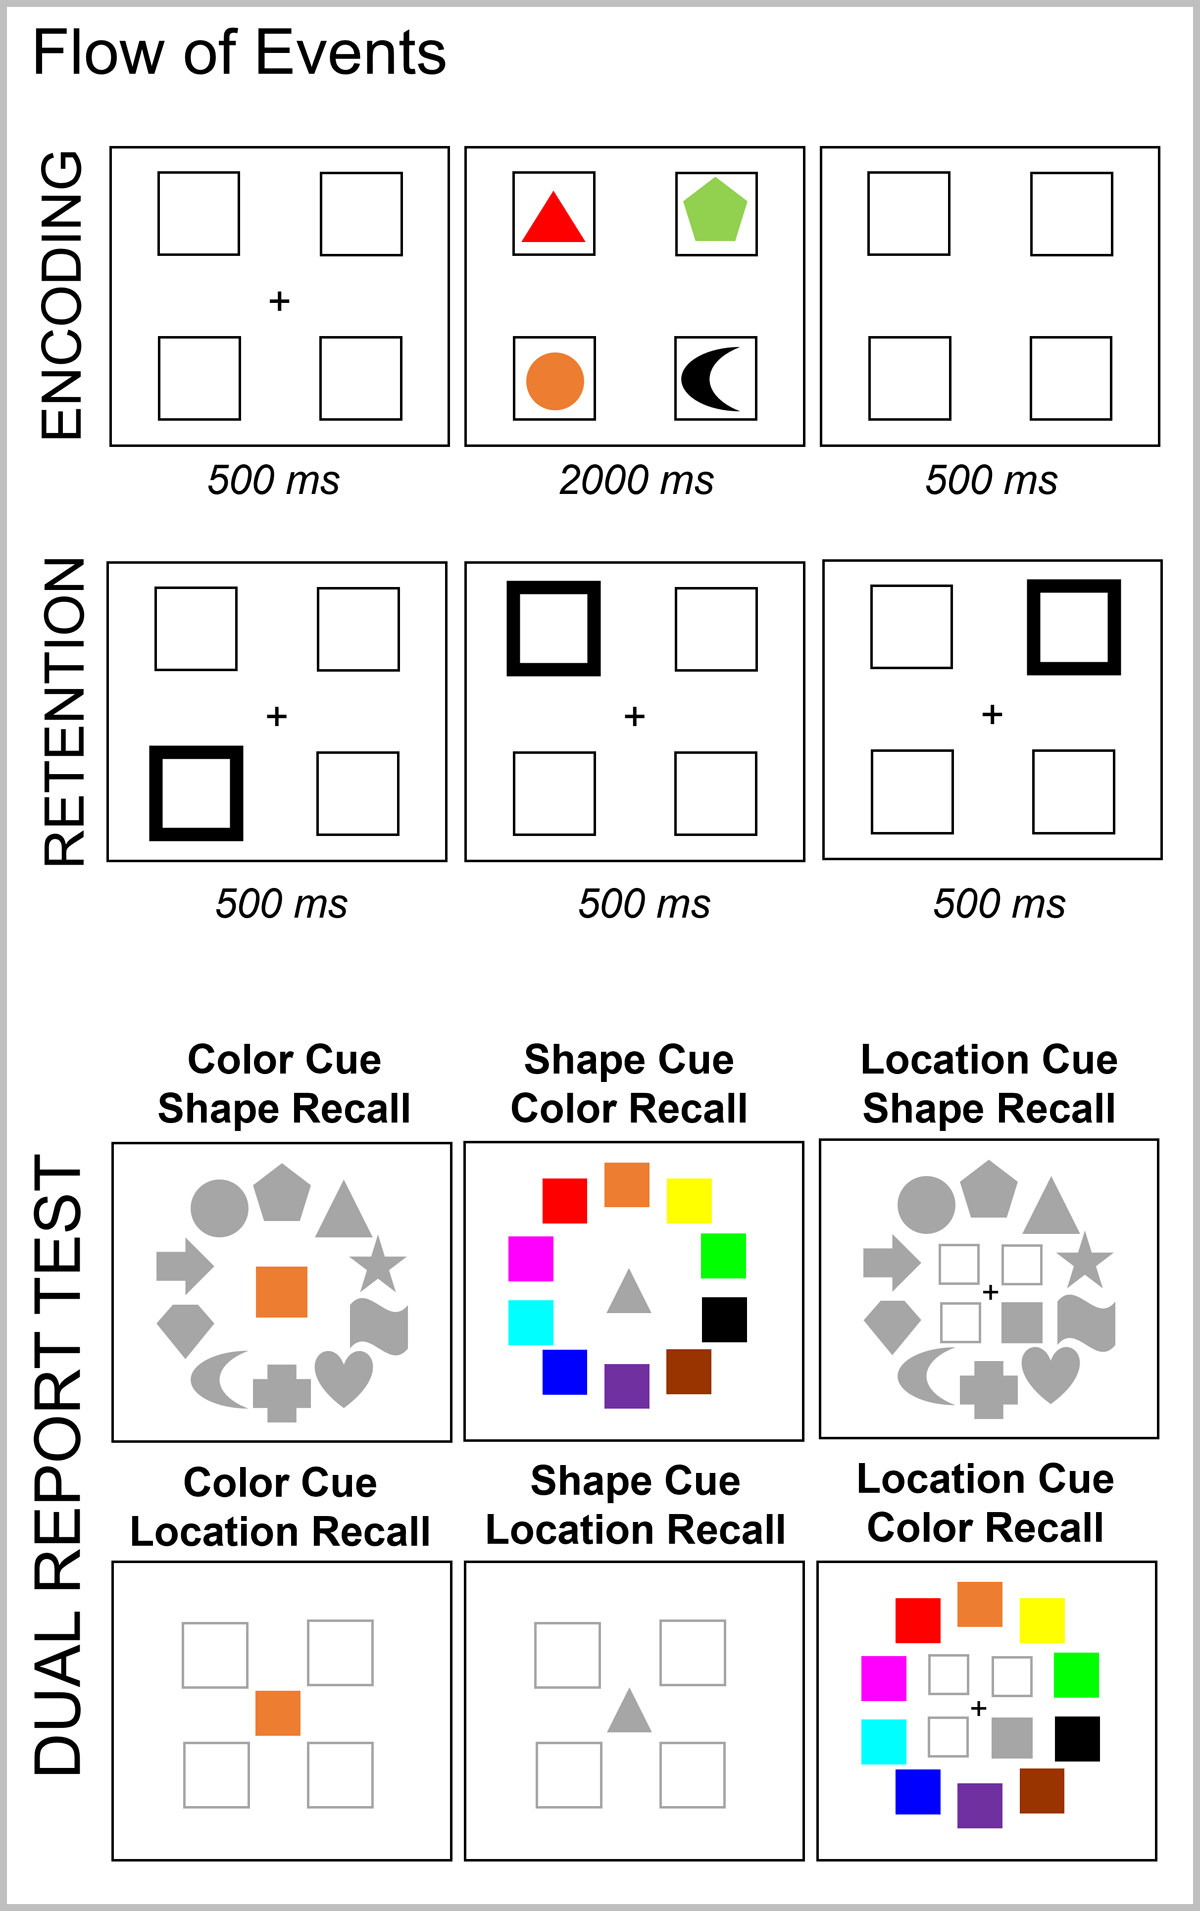
Figure 6
Illustration of the Flow of Events in Experiment 3.
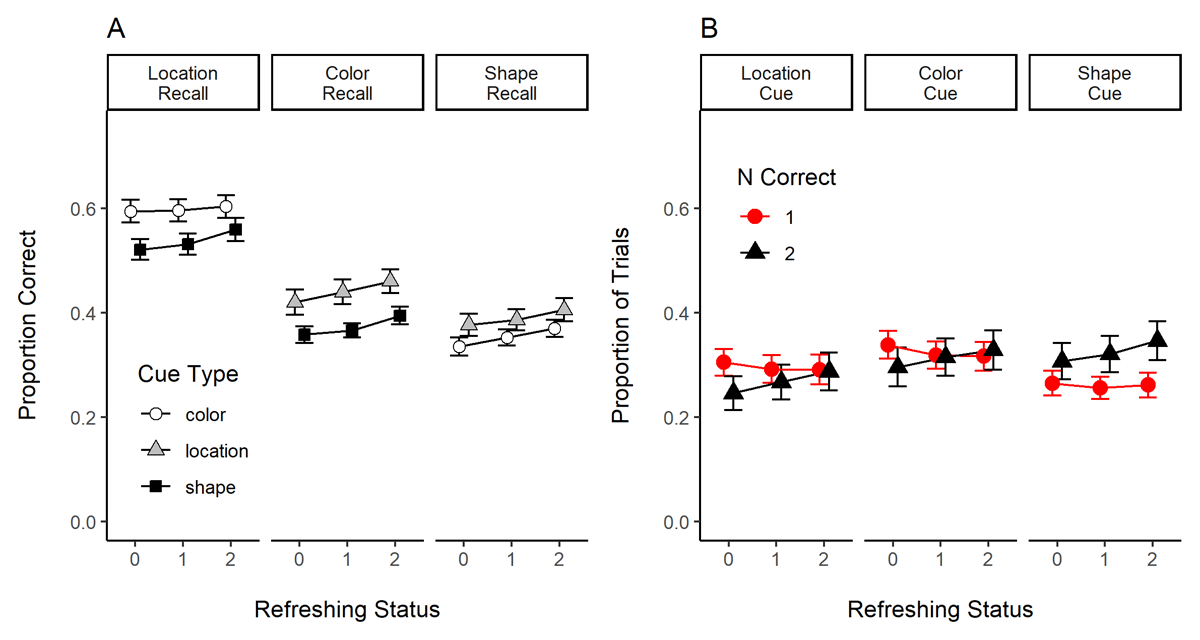
Figure 7
Results of Experiment 3. Panel A. Proportion of Correct Reports of Location, Color, and Shape as a Function of Refreshing Status and Recall Cue Type. Panel B. Proportion of Reports in a Trial with One Response Correct and With Both Responses Correct as a Function of Refreshing Status and Recall Cue Type.
Table 2
Evidence (BF10) for the Effect of Refreshing Status, Cue Type, and their Interaction on Proportion of Correct Recalls of Each Feature in Experiment 3.
| RECALLED FEATURE | REFRESHING STATUS | CUE TYPE | TWO-WAY INTERACTION |
|---|---|---|---|
| Location | 0.18 (±0.69%) | 2.0 × 10⁸ (±0.66%) | 0.07 (±0.87%) |
| Color | 98.53 (±0.81%) | 2.39 × 10¹⁵ (±0.78%) | 0.04 (±1.57%) |
| Shape | 31.13 (±0.46%) | 4.76 × 10⁵ (±0.45%) | 0.03 (±0.85%) |