
Table 1
Demographic information of the early blind and their matched sighted control (M = male; F = female; EB = early blind; SC = sighted control; M = mean; SD = standard deviation).
| EARLY BLIND | AGE | GENDER | YEARS OF EDUCATION | ONSET OF BLINDNESS | ETIOLOGY | SIGHTED CONTROLS | AGE | GENDER | YEARS OF EDUCATION |
|---|---|---|---|---|---|---|---|---|---|
| EB01 | 30 | M | 18 | 3 years | Glaucoma | SC01 | 28 | M | 18 |
| EB02 | 34 | M | 13 | Birth | Congenital anophthalmia | SC02 | 34 | M | 8 |
| EB03 | 33 | F | 18 | Birth | Retinopathy of Prematurity | SC03 | 29 | F | 18 |
| EB04 | 40 | M | 13 | 7 months | Retinopathy of Prematurity | SC04 | 37 | M | 13 |
| EB05 | 29 | F | 18 | Birth | Congenital microphthalmia | SC05 | 29 | F | 18 |
| EB06 | 30 | F | 18 | Birth | Agenesis of the optic nerves | SC06 | 27 | F | 18 |
| EB07 | 31 | F | 13 | Birth | Retinitis pigmentosa | SC07 | 30 | F | 13 |
| EB08 | 55 | F | 13 | 1 year | Retinoblastoma | SC08 | 55 | F | 13 |
| EB09 | 28 | M | 13 | Birth | Congenital toxoplasmosis | SC09 | 32 | M | 13 |
| EB10 | 33 | M | 13 | Birth | Retinal detachment | SC10 | 30 | M | 13 |
| EB11 | 34 | F | 13 | Birth | Retinopathy of Prematurity | SC11 | 37 | F | 13 |
| EB12 | 30 | M | 18 | Birth | Retinopathy of Prematurity | SC12 | 28 | M | 18 |
| EB13 | 38 | F | 13 | Birth | Congenital cataracts | SC13 | 41 | F | 13 |
| EB14 | 30 | F | 18 | Birth | Retinopathy of Prematurity | SC14 | 27 | F | 18 |
| EB15 | 32 | F | 13 | 1.5 years | Retinoblastoma | SC15 | 28 | F | 13 |
| EB16 | 35 | F | 16 | 4 years | Retinitis pigmentosa | SC16 | 36 | F | 16 |
| EB17 | 39 | F | 18 | Birth | Retrolental fibroplasia | SC17 | 41 | F | 18 |
| EB18 | 34 | M | 13 | Birth | Retinitis pigmentosa | SC18 | 33 | M | 13 |
| EB19 | 30 | F | 18 | Birth | Retinopathy of Prematurity | SC19 | 27 | F | 18 |
| EB20 | 36 | M | 16 | Birth | Optic nerve hypoplasia | SC20 | 35 | M | 16 |
| EB21 | 27 | M | 13 | 3 years | Dominant optic atrophy | SC21 | 30 | M | 13 |
| EB22 | 43 | M | 21 | Birth | Congenital retinopathy | SC22 | 47 | M | 21 |
| EB23 | 34 | F | 18 | Birth | Retinopathy of Prematurity | SC23 | 28 | F | 18 |
| EB24 | 52 | M | 8 | Birth | Congenital glaucoma | SC24 | 59 | M | 13 |
| EB25 | 49 | M | 13 | Birth | Optic nerve hypoplasia | SC25 | 45 | M | 13 |
| M | 35.44 | 15.16 | 34.92 | 15.16 | |||||
| SD | 7.23 | 2.94 | 8.60 | 2.94 |
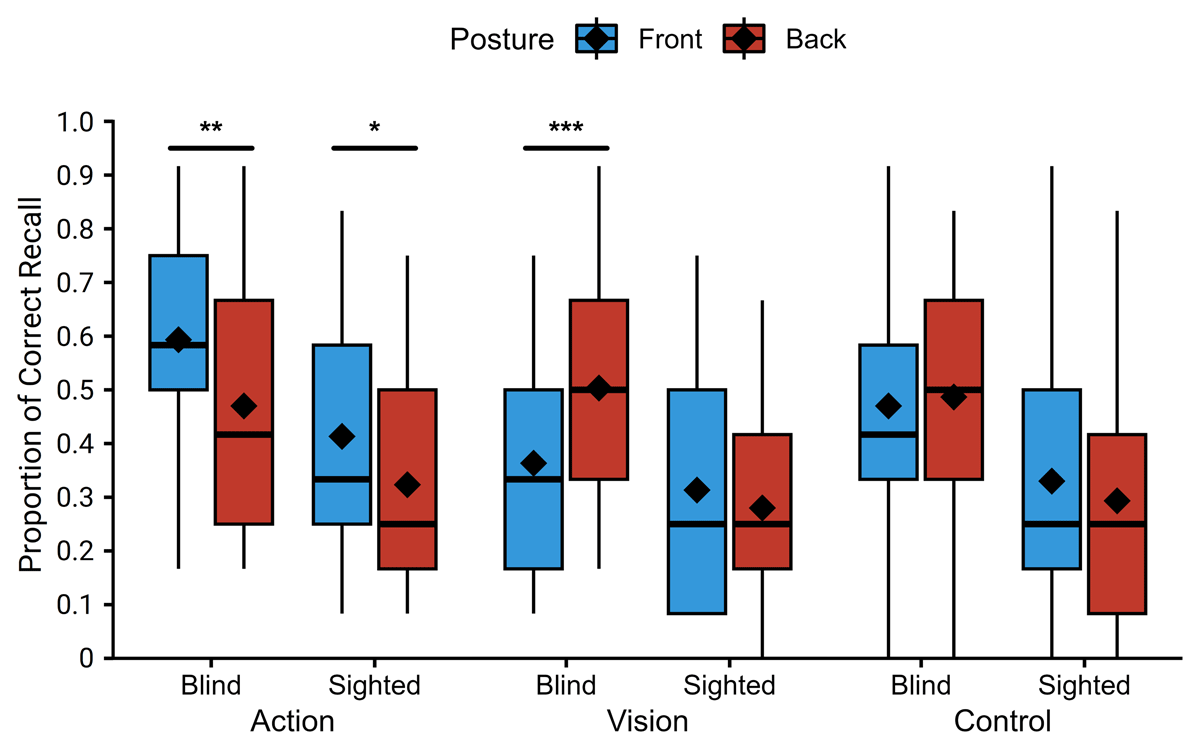
Figure 1
Percentage of recalled objects as a function of posture, group, and phrase type. Diamonds represent the mean; box and whisker plots represent the median and inter-quartile range (* p < .05; ** p < .01; *** p < .001).
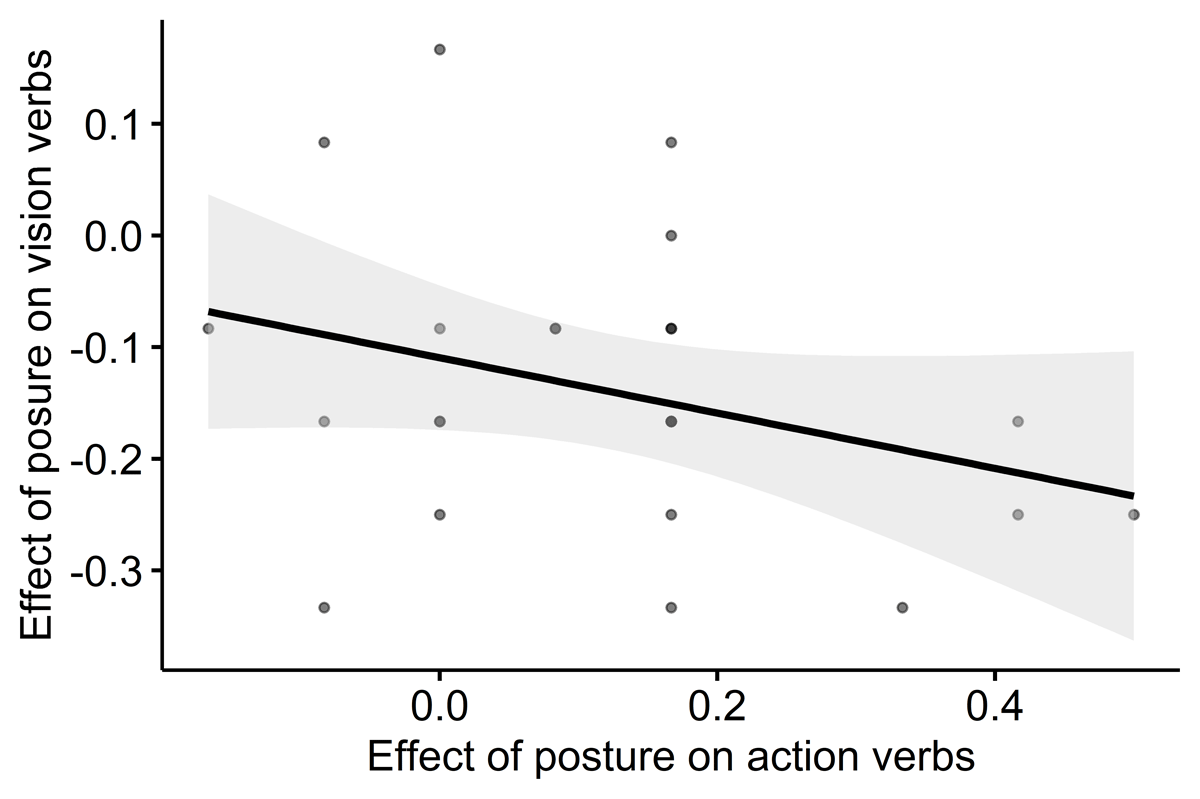
Figure 2
Scatterplot of the correlation between the the individual effects of posture on action and the individual effects of posture on vision phrases in blind participants. Shading represents 95% confidence intervals.