
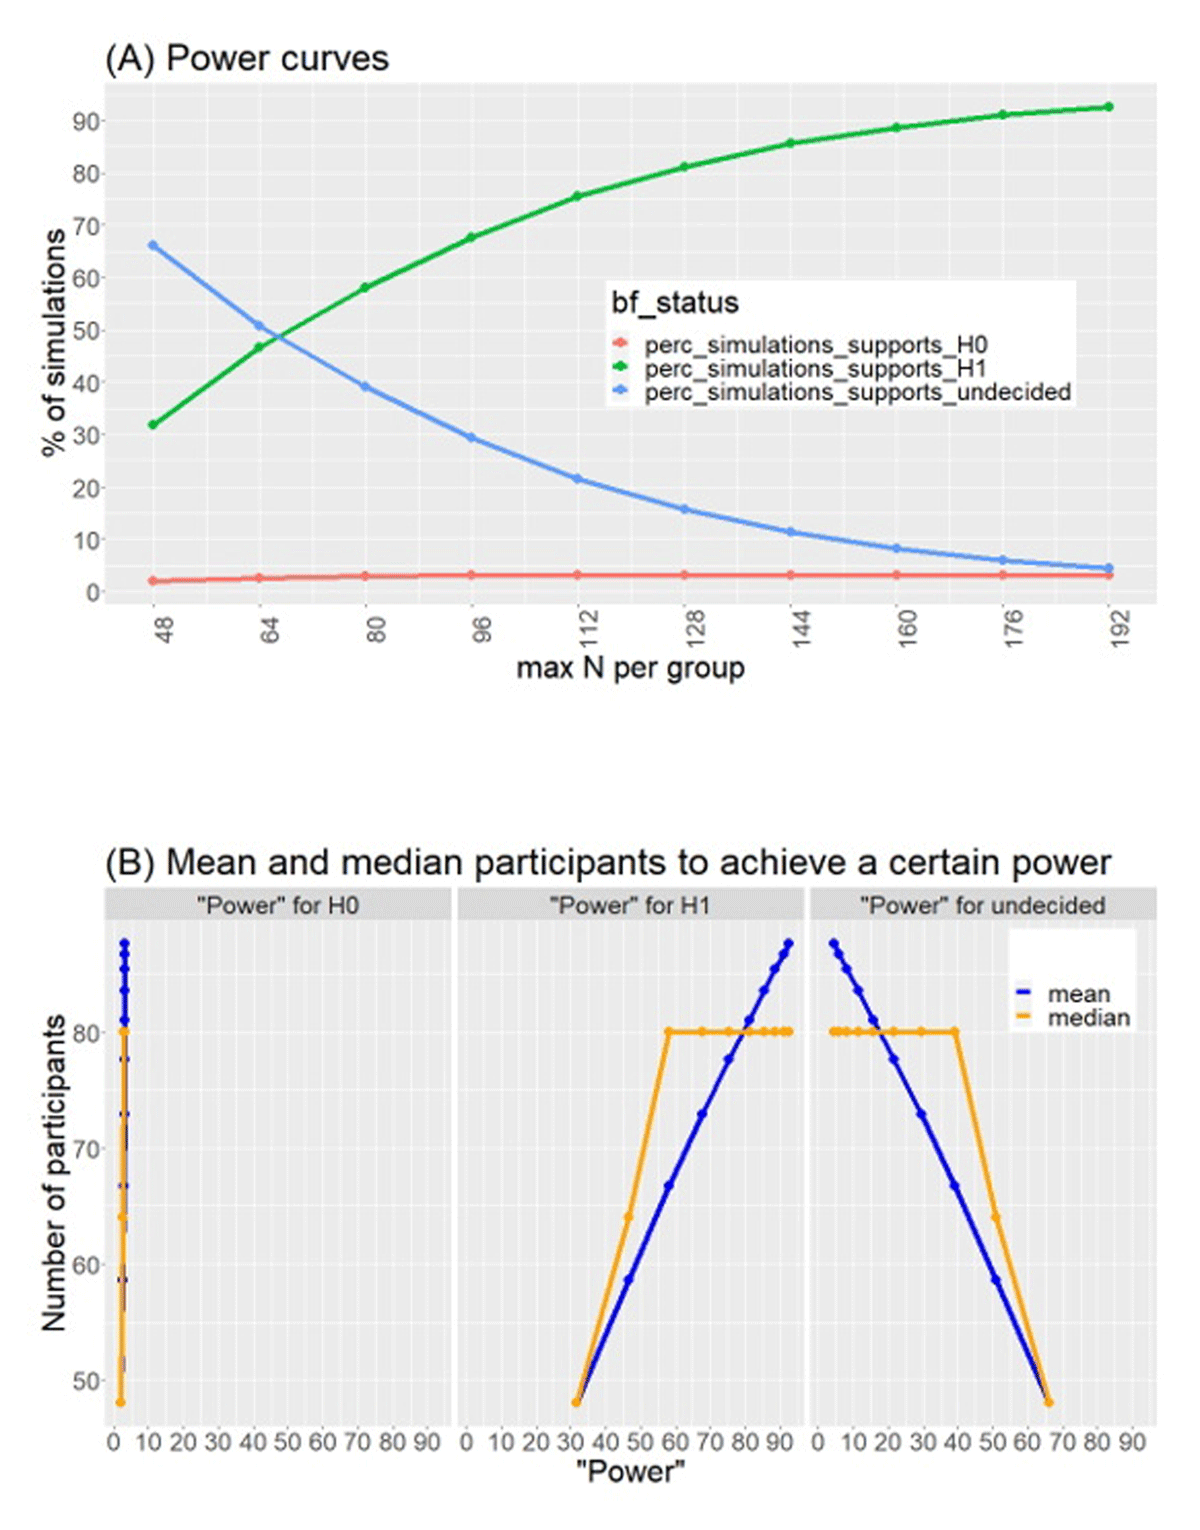
Figure 1
Results of simulations for sample-size determination. We simulated an effect size of 0.3 (medium-small). Panel A (top) shows power curves for % simulations that showed support for H0 (red), H1 (green) or were inconclusive (blue). Panel B (bottom) shows estimations of mean and median number of participants required to achieve a certain power.
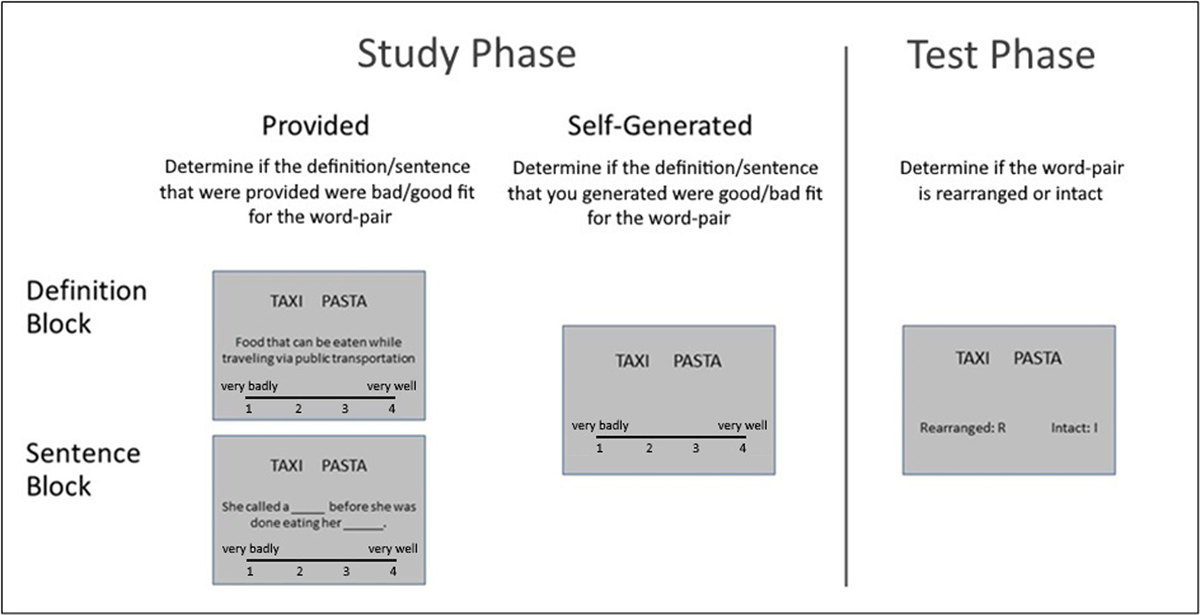
Figure 2
Schematic depiction of the experimental design. During the study phase, participants studied word-pairs in the context of definition or sentences that are either provided or self-generated. In a subsequent test phase, they discriminated between intact (studies) and rearranged pairs.
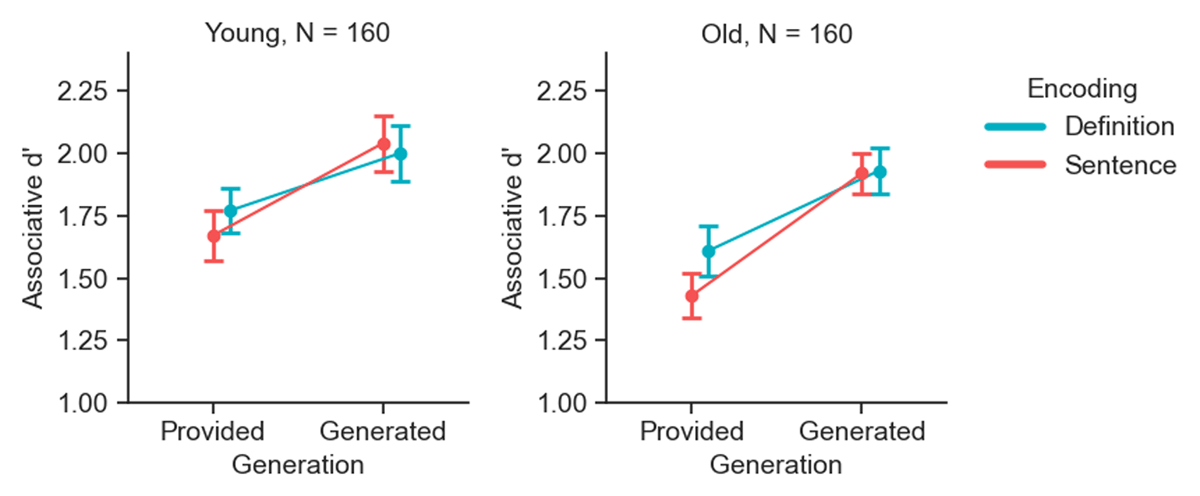
Figure 3
Associative recognition memory performance across encoding and generation conditions by age group. Associative d’ scores in the encoding and generation conditions, used in the main analysis, are shown. Separate plots depict data for young (left panel) and old (right panel) adults. Error bars represent 95% within-subjects confidence intervals.
Table 1
Bayes Factors for the main analysis. BFincl and BFexcl denote the Bayes Factors in favour of including and excluding the effect, respectively. We interpret Bayes Factors (BFs) greater than 6 as providing conclusive evidence. ∞ indicates a Bayes Factor so large it exceeds the software’s numerical limits, reflecting overwhelming evidence for the model.
| EFFECTS | BFINCL | BFEXCL |
|---|---|---|
| Encoding | 0.51 | 1.96 |
| Generation | ∞ | |
| Encoding × Generation | 1.76 | 0.57 |
| Age group | 0.29 | 3.42 |
| Encoding × Age group | 0.09 | 11.04 |
| Generation × Age group | 0.28 | 3.60 |
| Encoding × Generation × Age group | 0.02 | 63.11 |
Table 2
Bayesian Model Comparison across ten iterations. BFm denotes the Bayes Factor in favour of the model relative to the null model. Bolded BFm values indicate evidence supporting the better-performing model.
| ITERATION | GENERATION (BFM) | ENCODING + GENERATION + ENCODING × GENERATION (BFM) |
|---|---|---|
| 1 | 5.63 | 5.58 |
| 2 | 5.98 | 5.69 |
| 3 | 4.75 | 8.05 |
| 4 | 5.59 | 5.86 |
| 5 | 5.42 | 5.92 |
| 6 | 5.16 | 5.88 |
| 7 | 5.44 | 5.71 |
| 8 | 5.39 | 5.31 |
| 9 | 5.60 | 5.74 |
| 10 | 4.67 | 8.02 |
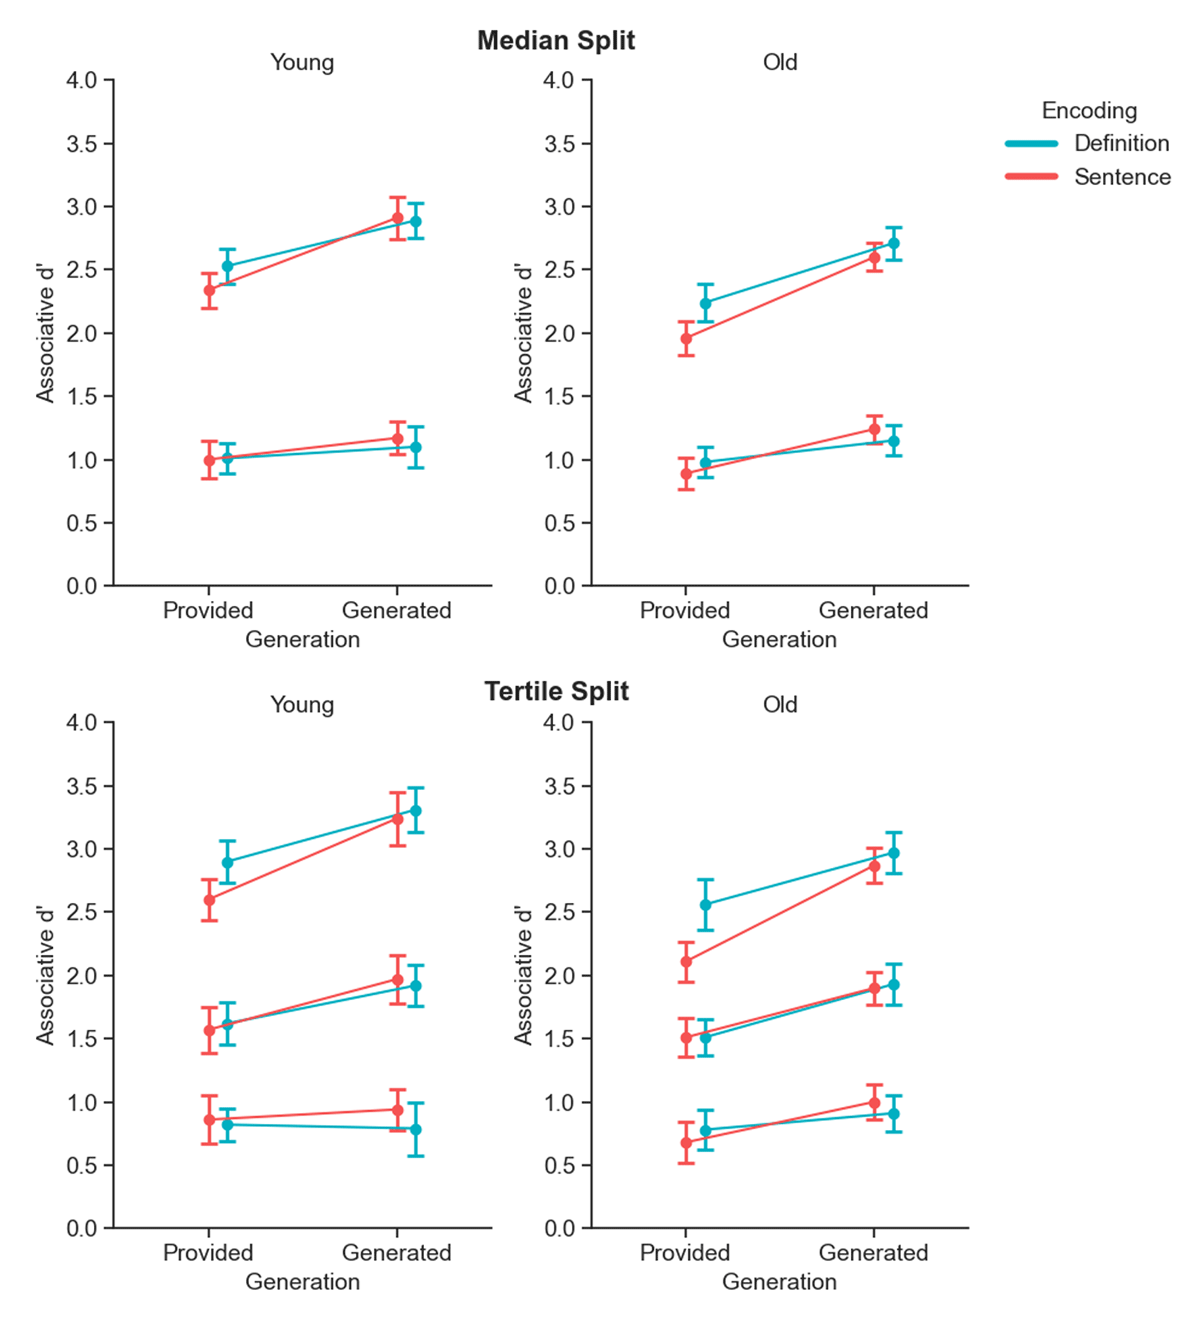
Figure 4
Median and tertile split of associative recognition memory performance. Associative d’ scores in the various encoding and generation conditions, for younger (left) and older (right) adults, categorized by participants’ performance. Performance is divided into two bins (median split, top row) and three bins (tertile split, bottom row) based on overall associative d’ scores. Error bars represent 95% within-subjects confidence intervals.
Table 3
Bayes Factors for Four-Way ANOVA Across Median and Tertile Splits. BFincl and BFexcl denote the Bayes Factors in favour of including and excluding the effect, respectively. ∞ indicates a Bayes Factor so large it exceeds the software’s numerical limits, reflecting overwhelming evidence for the model.
| EFFECTS | MEDIAN SPLIT | TERTILE SPLIT | ||
|---|---|---|---|---|
| BFINCL | BFEXCL | BFINCL | BFEXCL | |
| Encoding | 0.38 | 2.62 | 1.17 | |
| Generation | ∞ | ∞ | ||
| Encoding × Generation | 1.33 | 2.40 | ||
| Age group | 2.62 | 954.54 | ||
| Encoding × Age group | 0.11 | 8.77 | 0.15 | 6.82 |
| Generation × Age group | 0.34 | 2.99 | 0.35 | 2.83 |
| Encoding × Generation × Age group | 0.02 | 56.18 | 0.02 | 44.43 |
| Performance bins | ∞ | ∞ | ||
| Encoding × Performance bins | 0.64 | 1.57 | 2.98 | |
| Generation × Performance bins | 922.03 | 2202.50 | ||
| Encoding × Generation × Performance bins | 0.27 | 3.66 | 0.55 | 1.83 |
| Age group × Performance bins | 2.73 | 87.17 | ||
| Encoding × Age group × Performance bins | 0.05 | 20.91 | 0.04 | 23.10 |
| Generation × Age group × Performance bins | 0.19 | 5.15 | 0.14 | 7.17 |
| Encoding × Generation × Age group × Performance bins | 7.376 × 10⁻⁵ | 13558 | 1.658 × 10⁻⁵ | 60323 |