
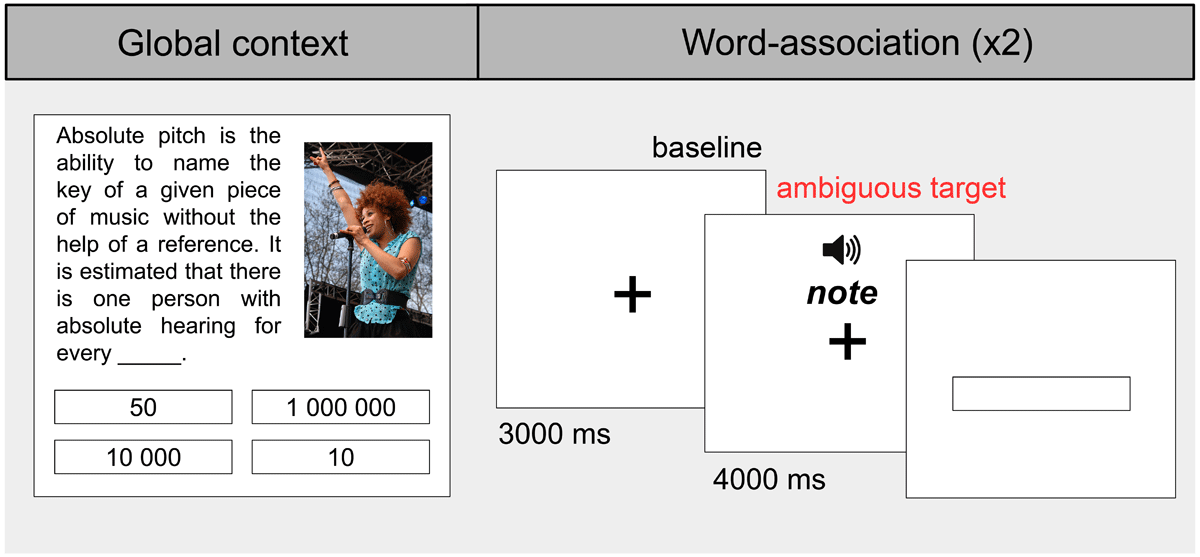
Figure 1
Experiment 1 example block. Each global context is followed by two word-associations: one corresponding to the matched condition (e.g., ‘note’) and one to the unmatched condition (e.g., ‘bank’). All words are presented in pseudorandom order across blocks.
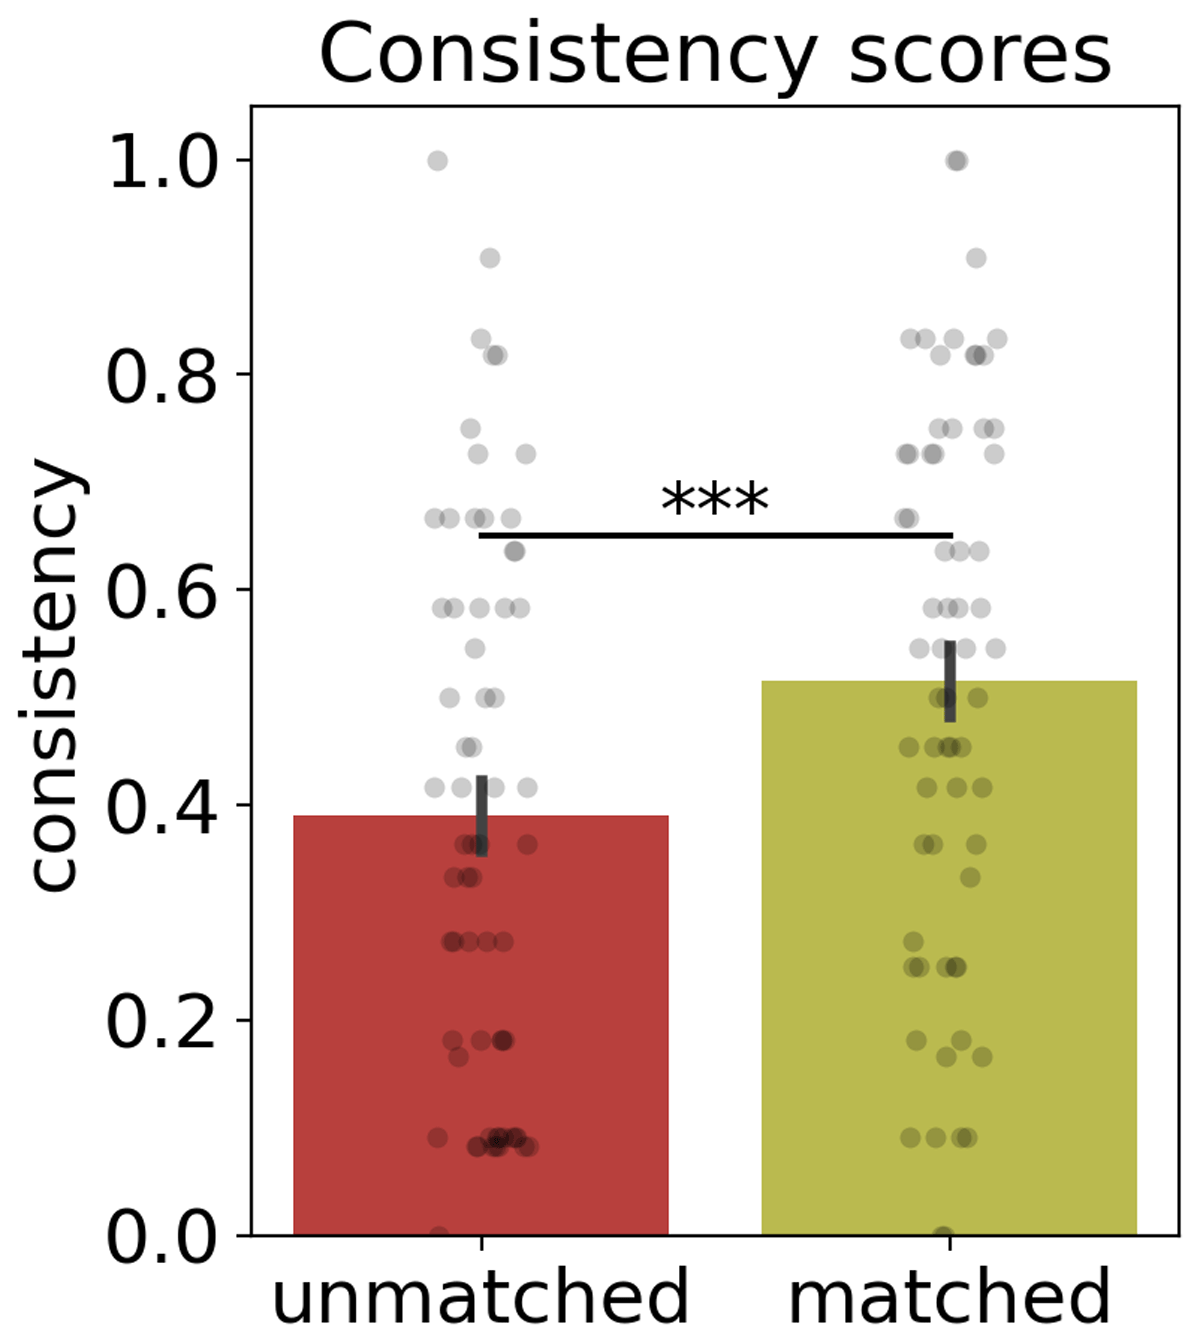
Figure 2
Experiment 1. Consistency scores of the unmatched and matched context conditions. Each bar provides the mean (±SEM) proportion of associate responses consistent with the context-related meaning across each condition. Points represent the mean consistency for each cue.***p < .0001.
Table 1
Experiment 1. Log-likelihood model comparisons for growth curve analysis.
| EFFECT | χ2 | Df | p |
|---|---|---|---|
| Linear polynomial | 9673.6 | 1 | <.001*** |
| Quadratic polynomial | 19097 | 1 | <.001*** |
| Cubic polynomial | 397.32 | 1 | <.001*** |
| Quartic polynomial | 313.74 | 1 | <.001*** |
| Context (levels: unmatched, matched) | 65.27 | 1 | <.001*** |
| Context × Linear polynomial | 34.99 | 1 | <.001*** |
| Context × Quadratic polynomial | 1.10 | 1 | .29 |
| Context × Cubic polynomial | 30.44 | 1 | <.001*** |
| Context × Quartic polynomial | .86 | 1 | .35 |
[i] Note. All models included random intercepts for participants and words. Random slopes for the linear, quadratic, and cubic terms were included by participants, and random slopes for the linear, quadratic, cubic, and quartic terms were included by words.
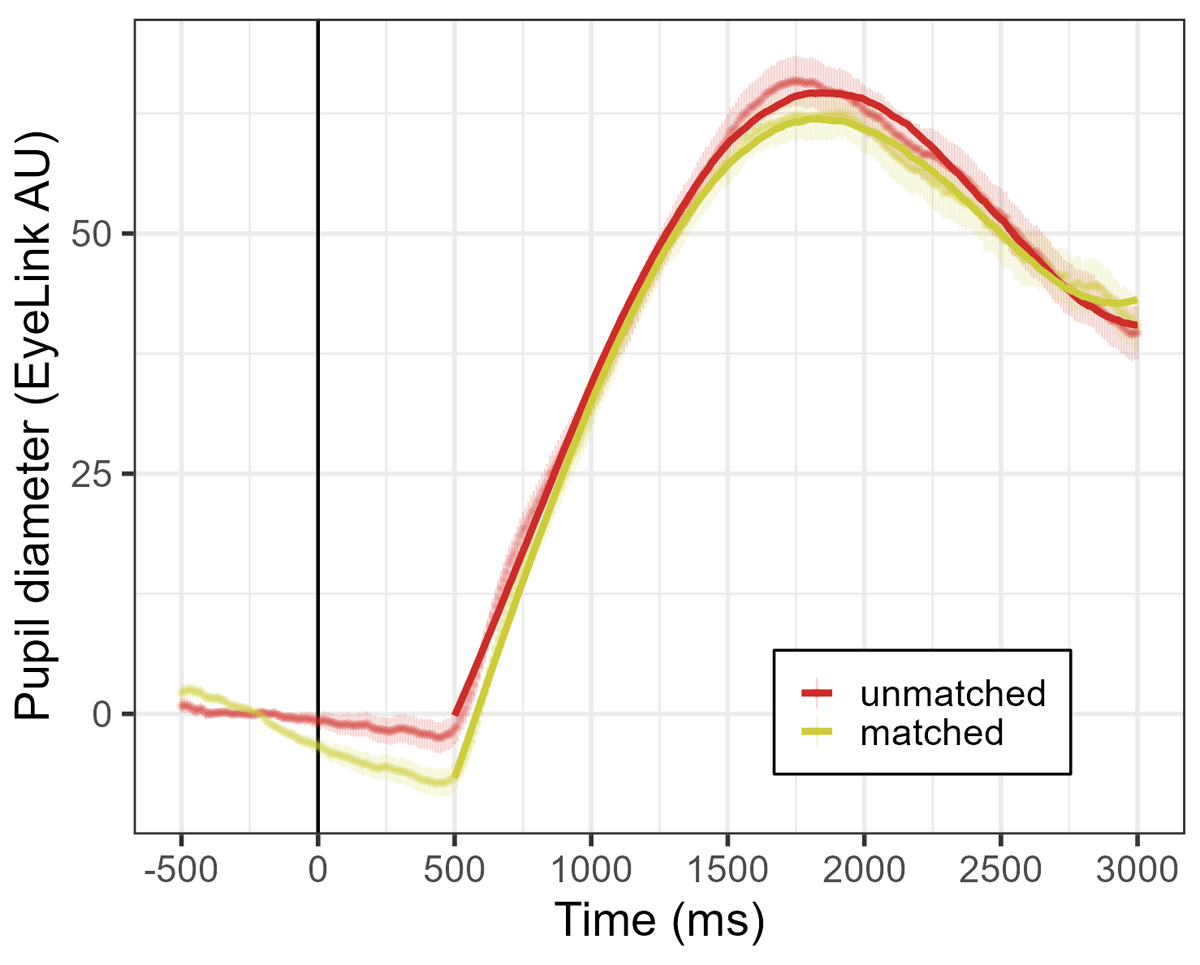
Figure 3
Experiment 1. Pupil diameter (EyeLink arbitrary units) over time for the unmatched (red) and matched (green) context conditions. Points represent the raw data means with standard errors, and GCA model fit is overlaid with solid lines. Auditory word onset time is represented as a solid vertical line.
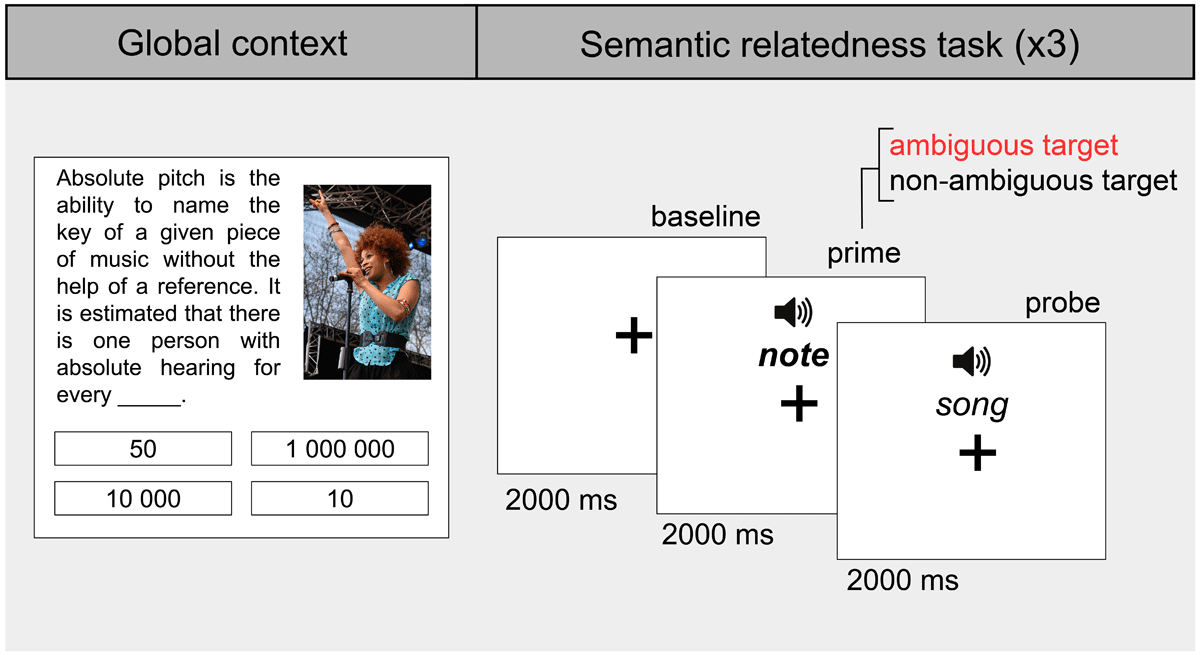
Figure 4
Experiment 2 example block. Each global context is followed by three semantic relatedness pairs: one corresponding to the matched context condition, one to the unmatched context condition, and one filler. All words are presented in pseudorandom order across blocks.
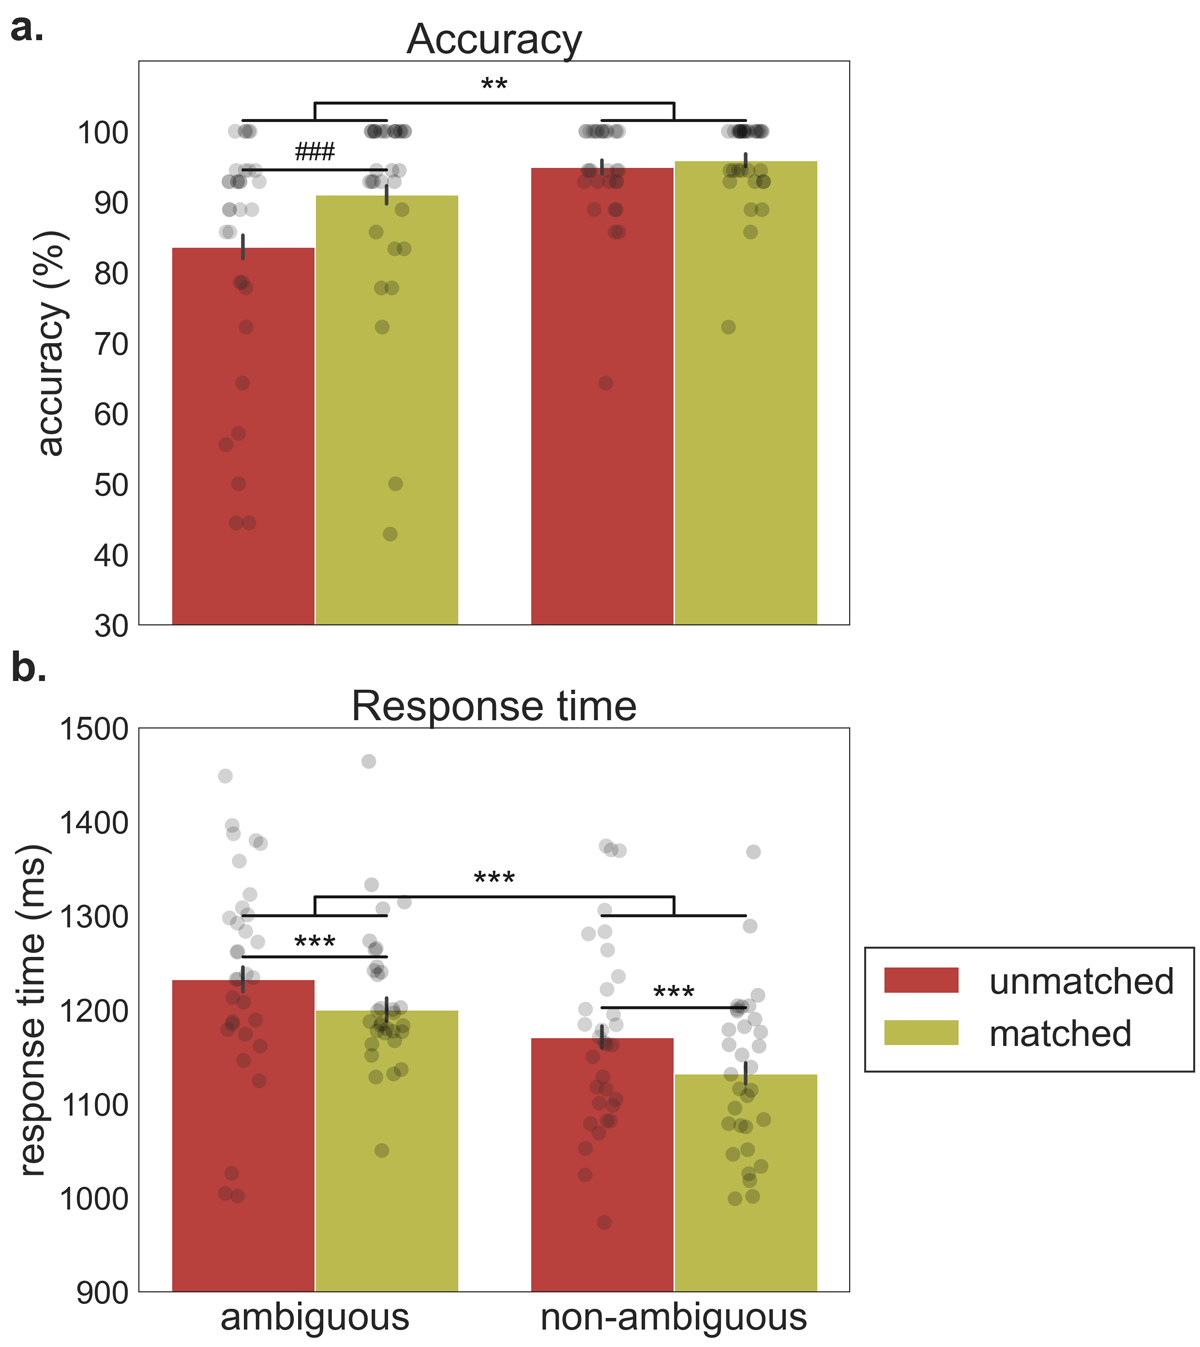
Figure 5
Experiment 2. Performance on the semantic relatedness task for ambiguous and non-ambiguous words of the unmatched and matched context conditions. Each bar provides the mean (±SEM) across each condition. Points represent the mean for each cue. a) Accuracy (percentage of correct prime-probe relatedness judgments). ###p < .001 (pairwise simple contrasts); **p < .01 (main effect). b) Response times (in milliseconds) for correct responses.***p < .001 (main effect).
Table 2
Experiment 2. Log-likelihood model comparisons for growth curve analysis.
| EFFECT | χ2 | Df | P |
|---|---|---|---|
| Linear polynomial | 1557.1 | 1 | <.001*** |
| Quadratic polynomial | 1958.8 | 1 | <.001*** |
| Cubic polynomial | 156.34 | 1 | <.001*** |
| Context (levels: unmatched, matched) | 473.72 | 1 | <.001*** |
| Word type (levels: non-ambiguous, ambiguous) | 1.18 | 1 | 0.28 |
| Context × Word type | 159.17 | 1 | <.001*** |
| Context × Linear polynomial | 15.43 | 1 | <.001*** |
| Context × Quadratic polynomial | 2.46 | 1 | .12 |
| Context × Cubic polynomial | 1.17 | 1 | .28 |
| Word type × Linear polynomial | .37 | 1 | .54 |
| Word type × Quadratic polynomial | 3.61 | 1 | .058 |
| Word type × Cubic polynomial | .03 | 1 | .86 |
[i] Note. All models included random intercepts for participants and words, and random slopes for the linear, quadratic and cubic terms by both participants and words.
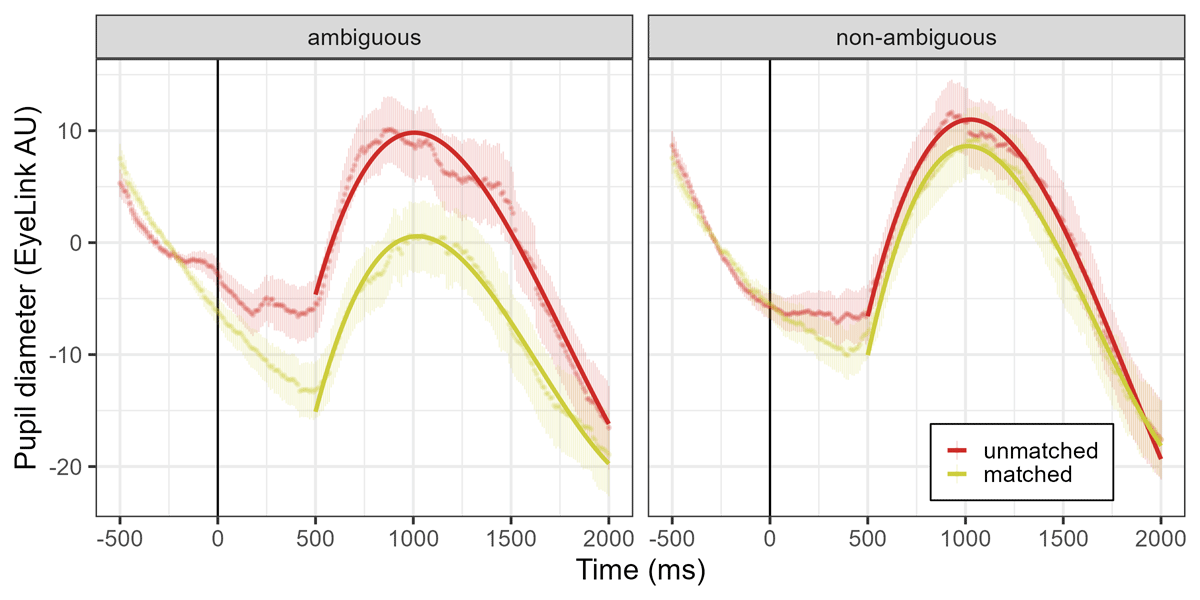
Figure 6
Experiment 2. Pupil diameter (EyeLink arbitrary units) over time for ambiguous and non-ambiguous words of the unmatched and matched context conditions. Points represent the raw data means with standard errors, and GCA model fit is overlaid with solid lines. Auditory word onset time is represented as a solid vertical line.