
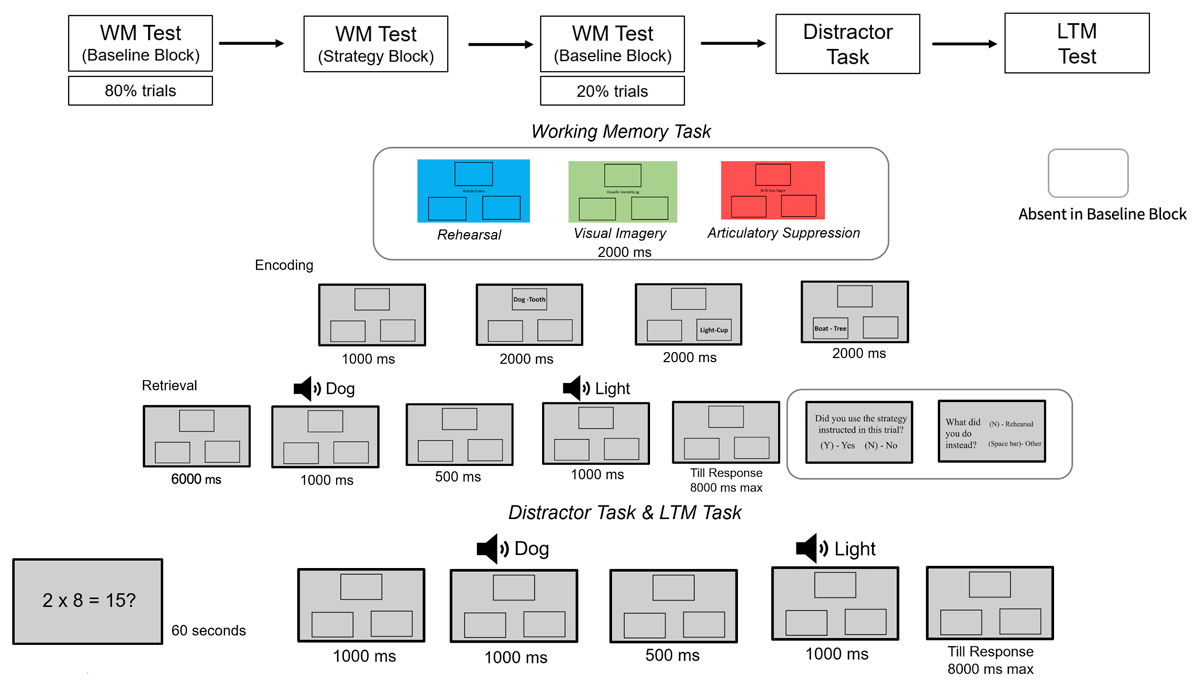
Figure 1
Sequence of events for Experiment 1.
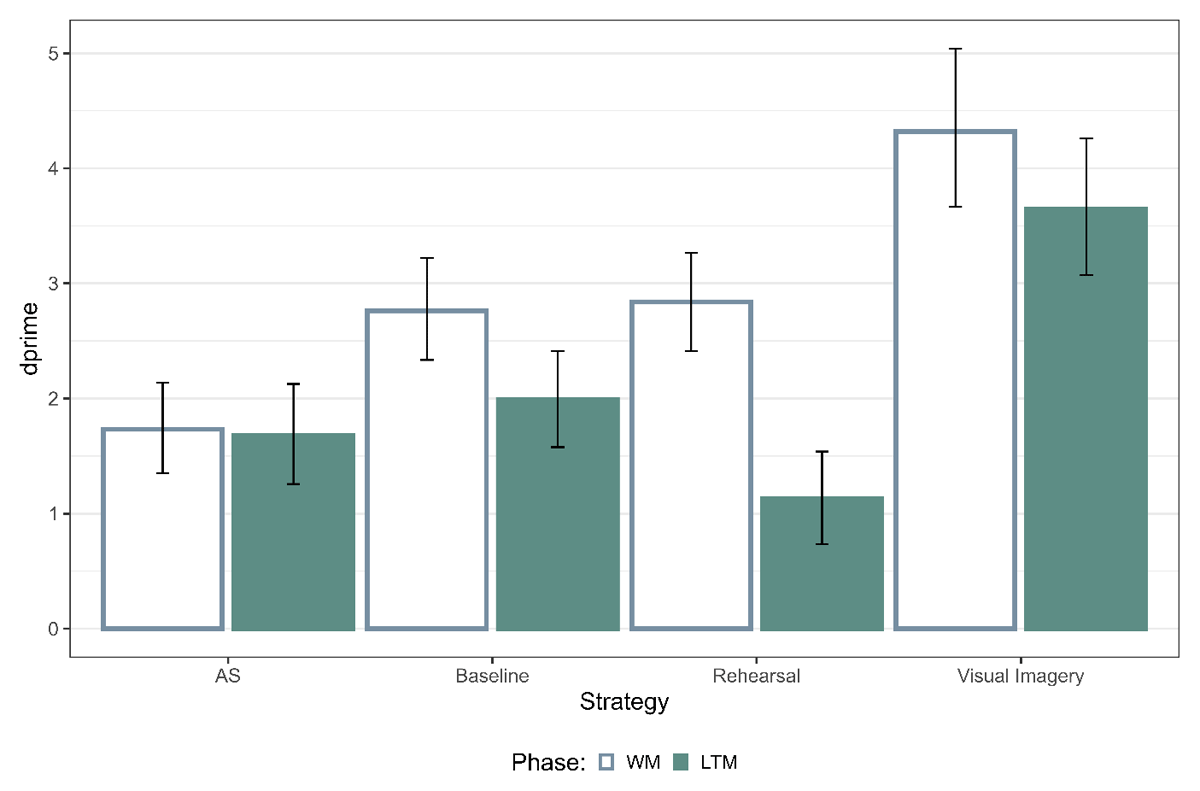
Figure 2
Memory performance for the WM and LTM Test. The error bars represent 95% highest posterior density intervals (HPD). Note: AS refers to articulatory suppression.
Table 1
Bayes Factors (BF10) for pairwise comparisons on the main effect of strategies on the measure of dprime for both the WM and LTM Test.
| STRATEGY | BASELINE | REHEARSAL | VISUAL IMAGERY | |||
|---|---|---|---|---|---|---|
| WM TEST | LTM TEST | WM TEST | LTM TEST | WM TEST | LTM TEST | |
| AS | 1.7 × 10² | 0.30 | 5.7 × 10² | 1.44 | 4.5 × 10⁷ | 7.5 × 10⁴ |
| Baseline | 0.17 | 80.51 | 8.9 × 10² | 6.3 × 10³ | ||
| Rehearsal | 1.6 × 10³ | 4.4 × 10⁶ | ||||
[i] Note: AS refers to articulatory suppression.
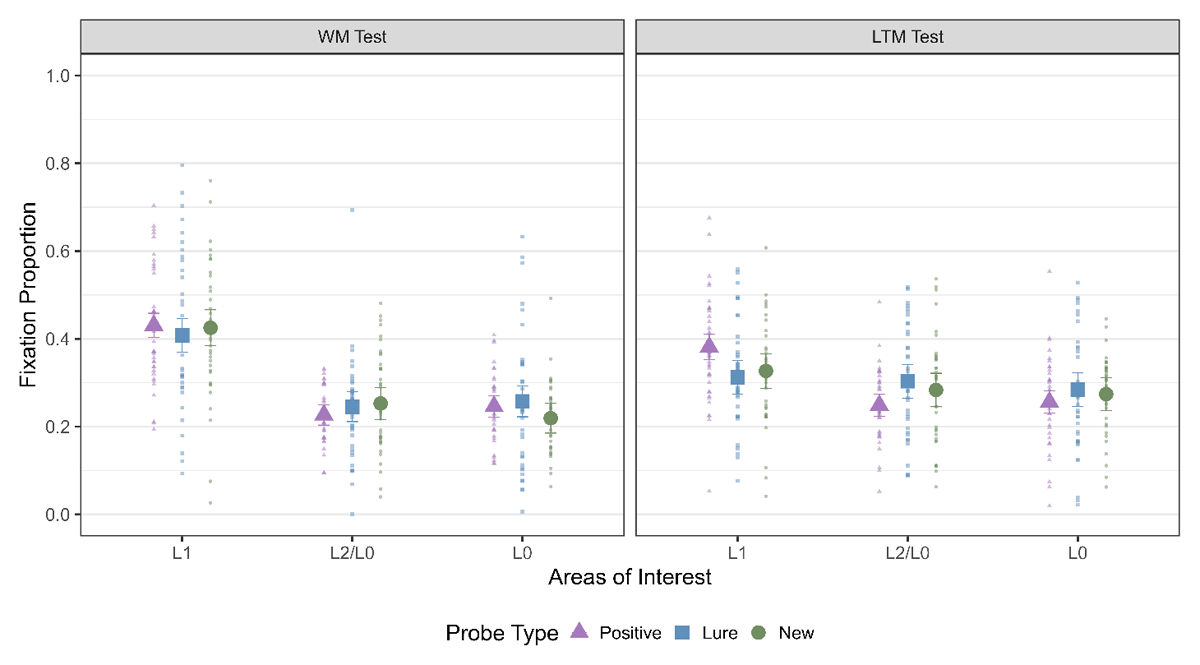
Figure 3
Fixation Proportion to the three AOIs across strategies for both WM and LTM Test. The error bars indicate 95% within subject confidence intervals.
Table 2
Bayes Factor (BF10) for a main effect of AOI across probe types for both WM and LTM Test. The AOIs were contrast coded as L1(2) and L2/L0 (–1).
| PROBE TYPE | WM TEST | LTM TEST |
|---|---|---|
| Positive | 1.08 × 10⁵ | 2.5 × 10² |
| Lure | 7.04 × 10³ | 0.08 |
| New | 2.75 × 10⁴ | 0.52 |
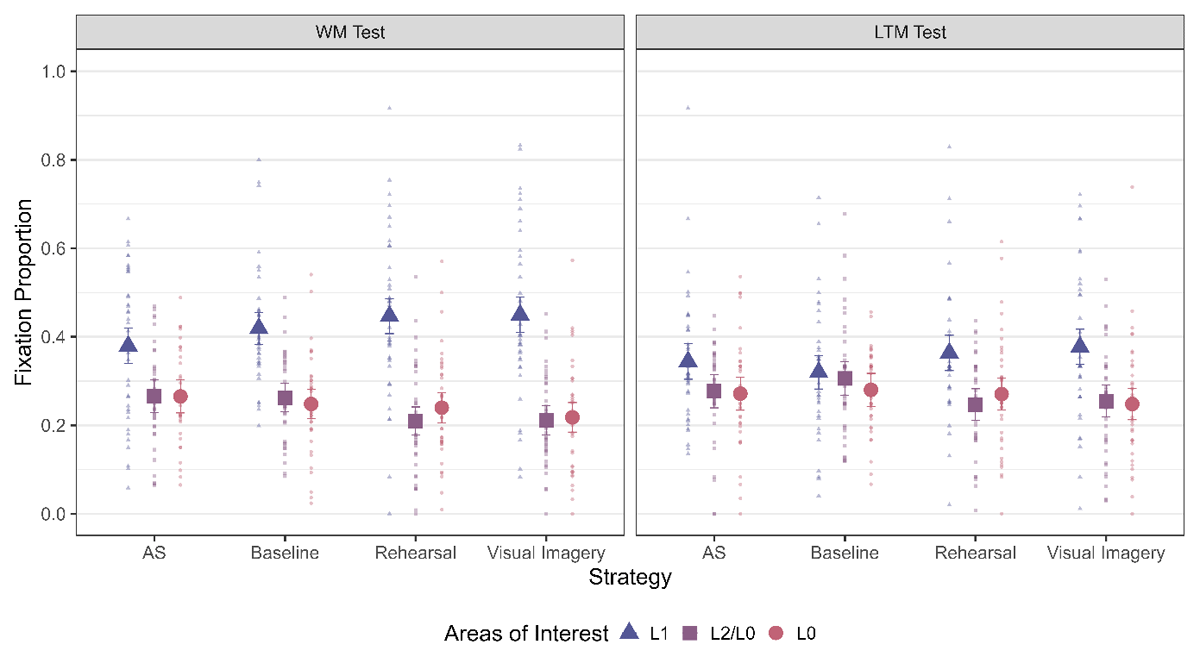
Figure 4
Fixation Proportion towards the three areas of interest across strategies and for the two phases. The error bars indicate 95% within subject confidence intervals.
Table 3
Bayes Factor (BF10) for a main effect of AOI across strategies for both WM and LTM Test. The AOIs were contrast coded as L1 (2) and L2/L0 (–1).
| STRATEGY | WM TEST | LTM TEST |
|---|---|---|
| AS | 4.23 | 0.52 |
| Baseline | 1.42 × 10³ | 0.05 |
| Rehearsal | 2.93 × 10³ | 7.62 |
| Visual Imagery | 8.20 × 10⁴ | 12.95 |
Table 4
Bayes Factor (BF10) for the pairwise comparisons between strategies for fixation proportion to L1 for both the WM and LTM Test.
| STRATEGY | BASELINE | REHEARSAL | VISUAL IMAGERY | |||
|---|---|---|---|---|---|---|
| WM TEST | LTM TEST | WM TEST | LTM TEST | WM TEST | LTM TEST | |
| AS | 0.13 | 0.06 | 0.09 | 0.05 | 0.14 | 0.05 |
| Baseline | 0.04 | 0.16 | 0.04 | 0.11 | ||
| Rehearsal | 0.05 | 0.04 | ||||
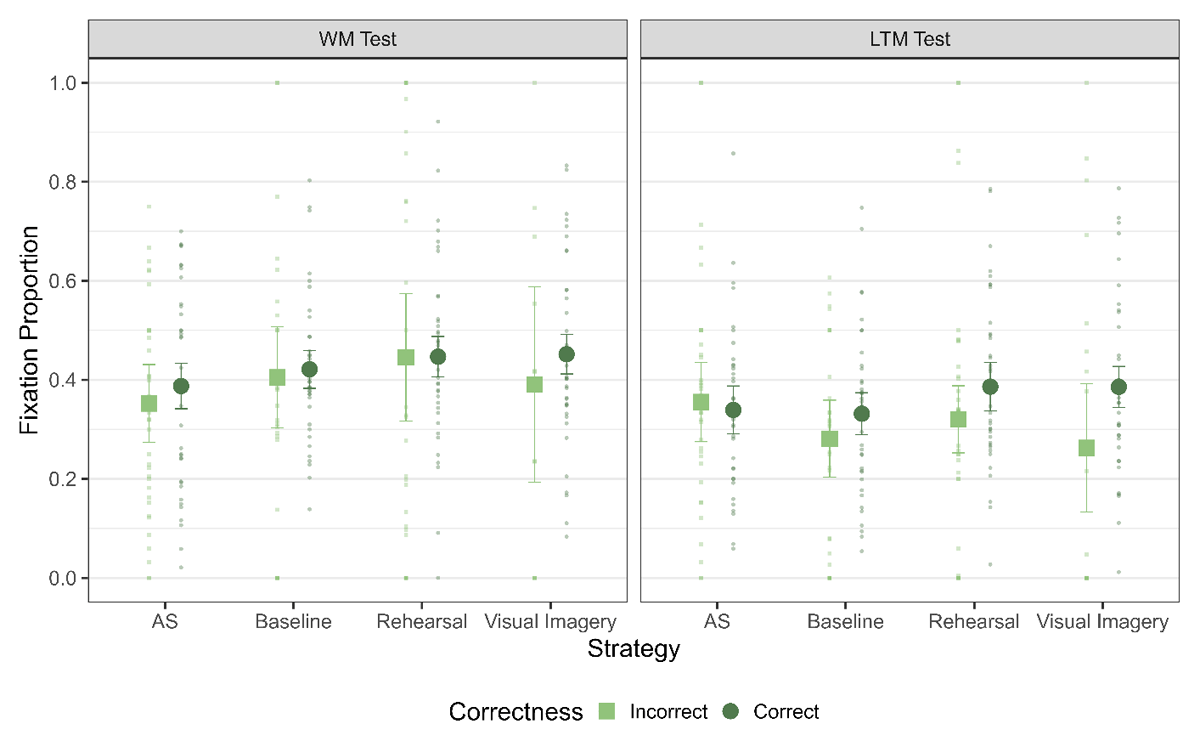
Figure 5
Fixation Proportion to L1 across the strategies for trials with correct and incorrect responses for the WM Test. The error bars indicate 95% of within subject confidence intervals.
Table 5
Bayes Factors (BF10) for the main effect of correctness for fixation proportion to L1 for WM test, LTM test and Retention Interval.
| STRATEGY | WM TEST | LTM TEST | RETENTION INTERVAL |
|---|---|---|---|
| AS | 0.06 | 0.05 | 0.05 |
| Baseline | 0.06 | 0.07 | 0.07 |
| Rehearsal | 0.05 | 0.08 | 0.05 |
| Visual Imagery | 0.11 | 0.10 | 0.09 |
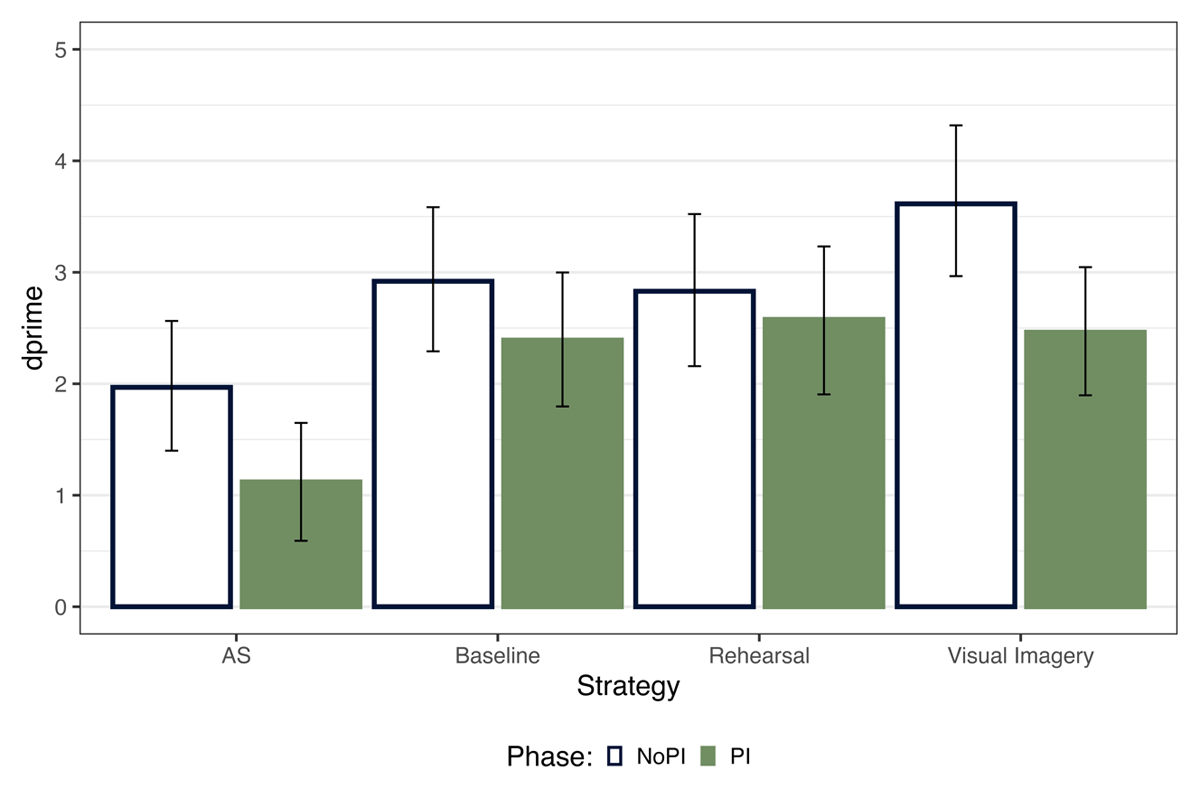
Figure 6
dprime across the PI and No PI Block. The error bars indicate 95% highest posterior density intervals.
Table 6
Bayes Factor (BF10) for a main effect of strategy on the measure of dprime across the two PI sessions.
| STRATEGY | BASELINE | REHEARSAL | VISUAL IMAGERY | |||
|---|---|---|---|---|---|---|
| PI | NO PI | PI | NO PI | PI | NO PI | |
| AS | 91.43 | 4.02 | 3.1 × 10² | 2.00 | 4.3 × 10² | 3.3 × 10² |
| Baseline | 0.22 | 0.21 | 0.16 | 0.90 | ||
| Rehearsal | 0.19 | 1.02 | ||||
Table 7
Bayes Factor (BF10) for a main effect of AOI across probe types for both PI and NoPI Test. The AOIs were contrast coded as L1(2) and L2/L0 (–1).
| PROBE TYPE | PI TEST | NOPI TEST |
|---|---|---|
| Positive | 98.17 | 3.01 × 10² |
| Within Trial Lure | 49.81 | 6.37 × 10² |
| Old Trial Lure | 6.15 | 83.87 |
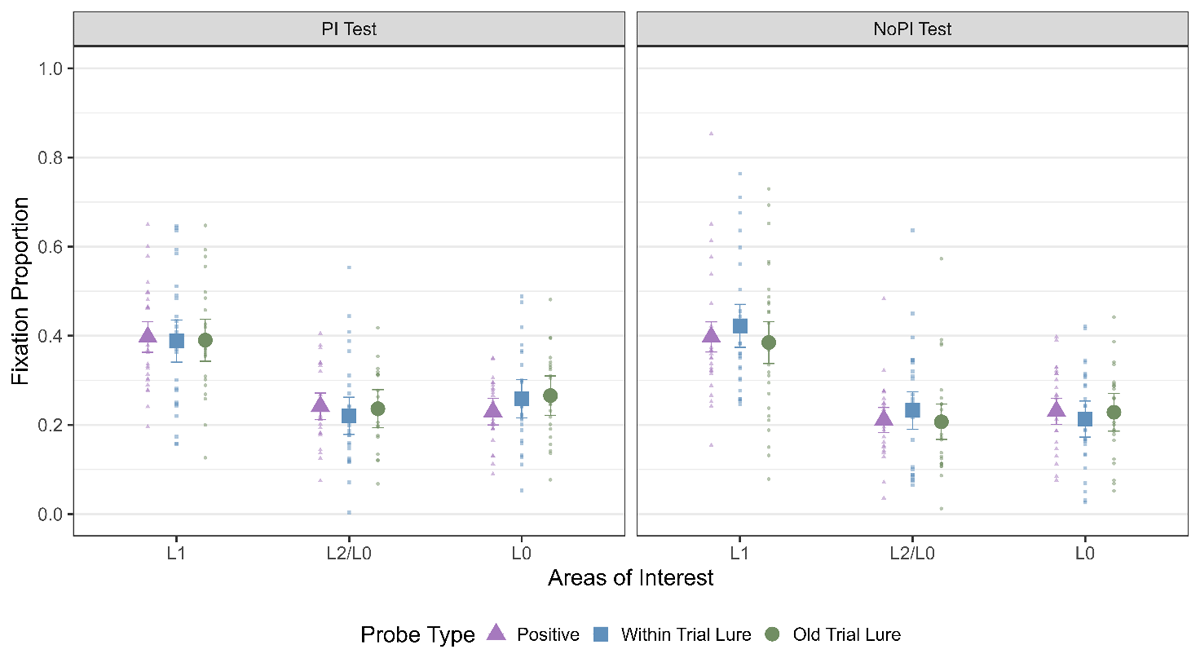
Figure 7
Fixation Proportion to all three areas of interest for all the three probe types for both the No PI and PI session. The error bars indicate 95% within subject confidence intervals.
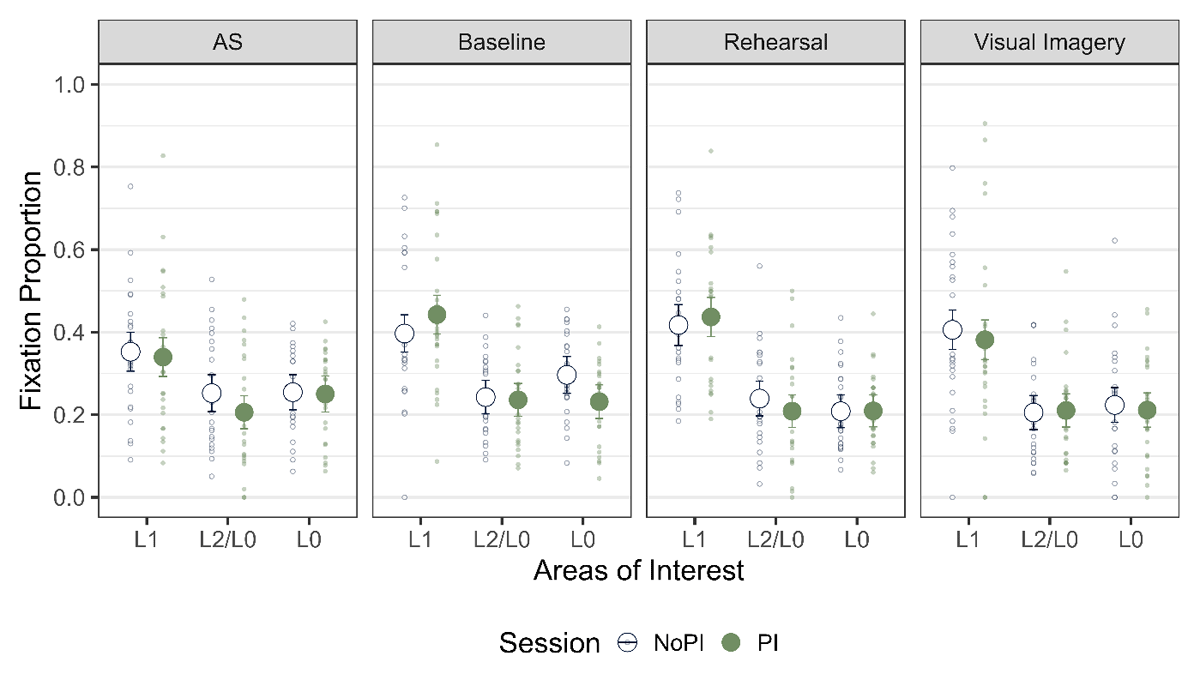
Figure 8
Fixation Proportion across the two phases and across all the strategies. The error bars indicate 95% within subject confidence intervals.
Table 8
Bayes Factor (BF10) for a main effect of AOI across strategies for both PI and NoPI Test. The AOIs were contrast coded as L1 (2) and L2/L0 (–1).
| STRATEGY | PI TEST | NOPI TEST |
|---|---|---|
| AS | 0.4 | 0.52 |
| Baseline | 2.87 | 1.3 × 10³ |
| Rehearsal | 3.6 × 10² | 4.3 × 10³ |
| Visual Imagery | 80.61 | 58.27 |
Table 9
Bayes Factor (BF10) for a main effect of strategies for fixation proportion to L1 for both PI and No PI session.
| STRATEGY | BASELINE | REHEARSAL | VISUAL IMAGERY | |||
|---|---|---|---|---|---|---|
| NO PI | PI | NO PI | PI | NO PI | PI | |
| AS | 0.38 | 0.06 | 1.06 | 0.15 | 0.06 | 0.06 |
| Baseline | 0.04 | 0.05 | 0.12 | 0.06 | ||
| Rehearsal | 0.21 | 0.09 | ||||
Table 10
Bayes Factor (BF10) for a main effect of PI Session for fixation proportion to L1 across all the strategies.
| STRATEGY | BF10 |
|---|---|
| AS | 0.04 |
| Baseline | 0.05 |
| Rehearsal | 0.03 |
| Visual Imagery | 0.03 |
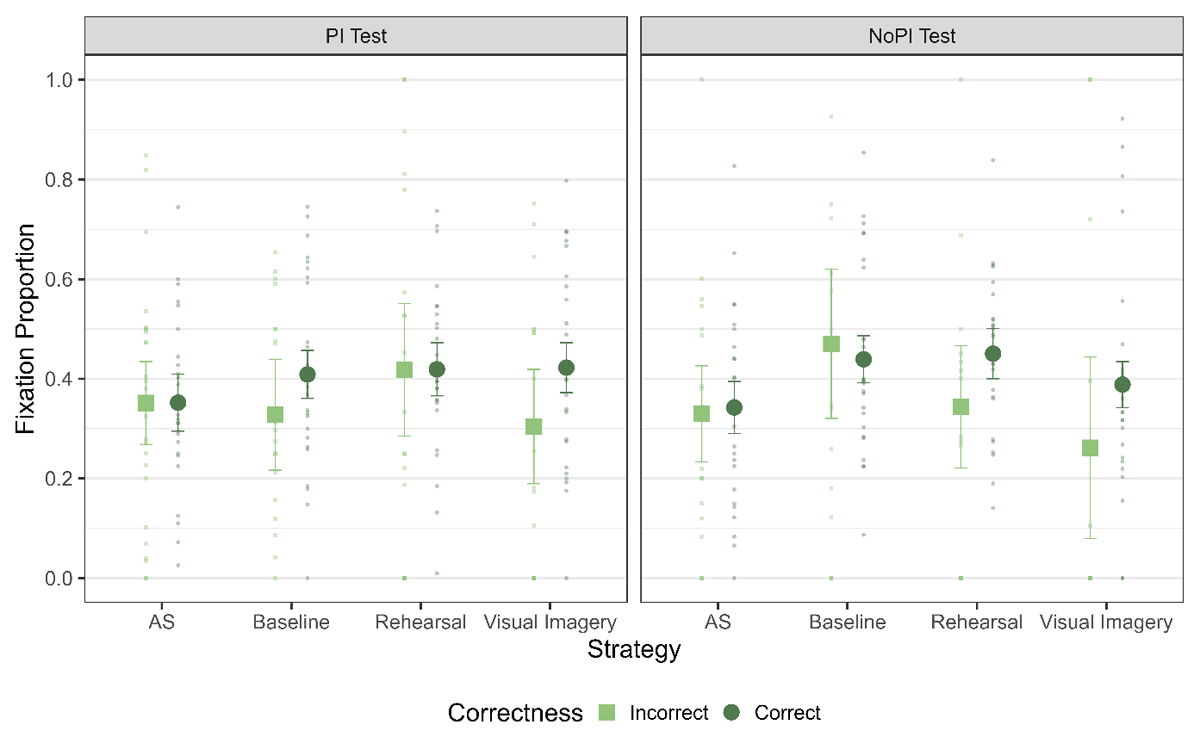
Figure 9
Fixation Proportion towards L1 across the two phases and correctness on the trial. The error bars indicate 95% within subject confidence intervals.
Table 11
Bayes Factor (BF10) for a main effect of correctness of response for fixation proportion to L1 for PI and No PI sessions and for their respective Retention Intervals.
| STRATEGY | WM TEST | RETENTION INTERVAL | ||
|---|---|---|---|---|
| PI | NO PI | PI | NO PI | |
| AS | 0.04 | 0.05 | 0.05 | 0.69 |
| Baseline | 0.15 | 0.05 | 0.04 | 0.17 |
| Rehearsal | 0.06 | 0.20 | 0.05 | 0.05 |
| Visual Imagery | 0.10 | 0.18 | 0.05 | 0.09 |