
Table 1
Descriptive statistics of time-related stimuli.
| VARIABLE | PAST-RELATED WORDS | FUTURE-RELATED WORDS | COMPARISON (T-TEST) |
|---|---|---|---|
| Time position | 3.065 (0.937) | 6.521 (0.721) | t(38) = 12.741, p < .001 |
| Length | 7.150 (1.526) | 7.750 (1.997) | t(38) = 1.041, p = .305 |
| Frequency | 2.321 (0.984) | 2.316 (1.133) | t(38) = –0.013, p = .990 |
[i] Note. Time position could range from 1 (“related to very distant past”) through 5 (“related to the present moment”) to 9 (“related to very distant future”) and was measured in units on a Likert scale; see main text for details. Numbers in cells indicate mean values, and numbers in parentheses indicate SDs. Length was measured in letters. Frequency was measured in ipm (items per million).
Table 2
Descriptive statistics for time-related vs. non-related words in Experiment 1.
| TIME-RELATED WORDS | TIME NON-RELATED WORDS | COMPARISON (T-TEST) | ||||
|---|---|---|---|---|---|---|
| MEAN | SD | MEAN | SD | T | P | |
| Length | 7.450 | 1.825 | 6.783 | 2.235 | –1.705 | .090 |
| Frequency | 2.319 | 1.075 | 2.049 | 0.701 | –1.827 | .070 |
[i] Note. In Experiment 1, the non-time category included 120 stimuli, while the time category had 40 stimuli (20 past- and 20 future-related; see Table 1).
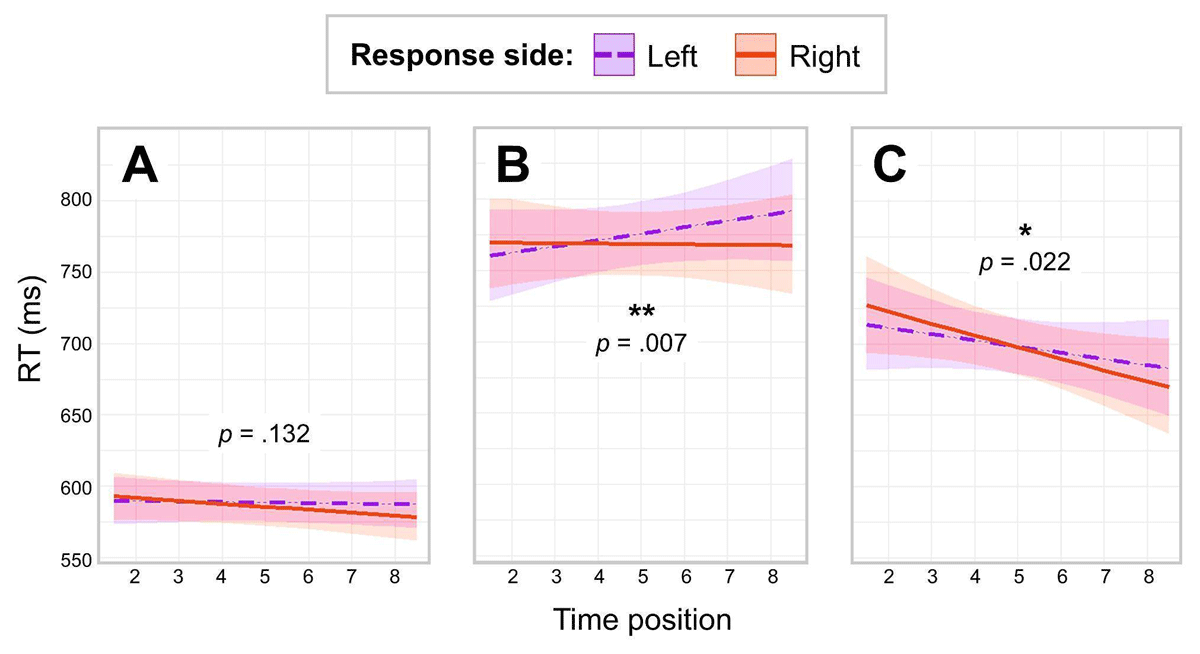
Figure 1
Predicted RTs as a function of Response Side and Time Position in three experiments.
Note. Panel A: Results of Experiment 1 (word animacy task). Panel B: Results of Experiment 2 (space-relatedness task). Panel C: Results of Experiment 3 (time-relatedness task).
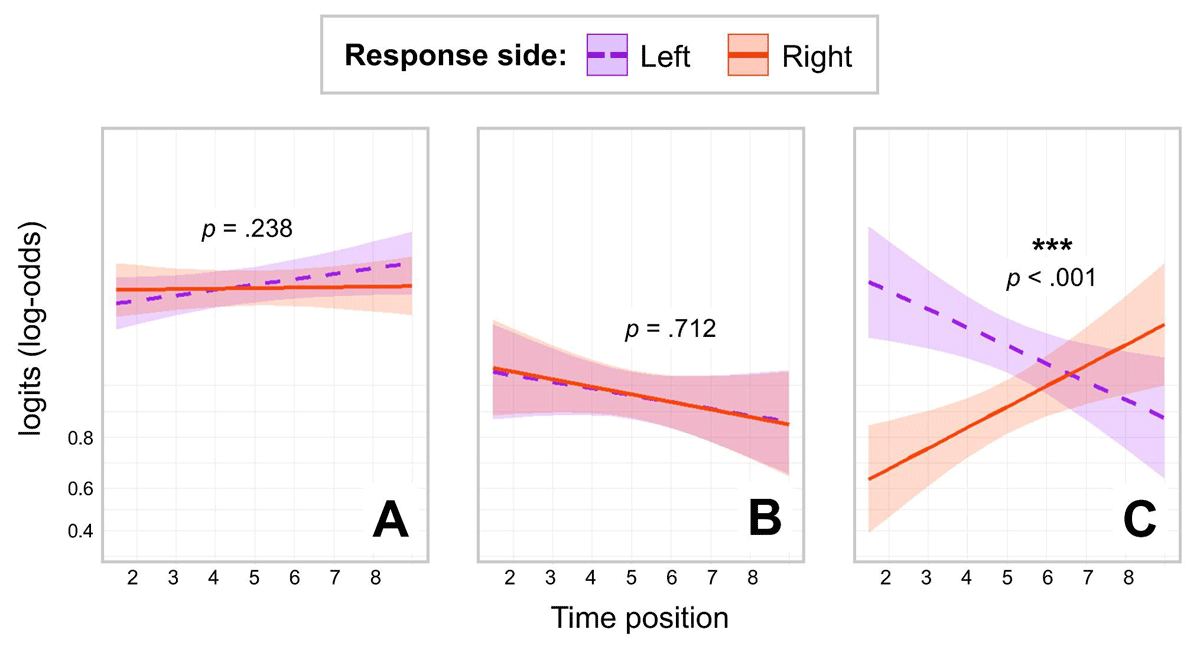
Figure 2
Results for the analysis of Accuracy as a function of Response Side and Time Position in three experiments.
Note. Panel A: Results of Experiment 1 (word animacy task). Panel B: Results of Experiment 2 (space-relatedness task). Panel C: Results of Experiment 3 (time-relatedness task). The Y-axis represents logits (log-odds) to display the linear trend. For back-transformed accuracy values, see Figure D1 in Appendix.
Table 3
Descriptive statistics for time-related vs. non-related words in Experiment 2.
| TIME-RELATED WORDS | TIME NON-RELATED WORDS | COMPARISON (T-TEST) | ||||
|---|---|---|---|---|---|---|
| MEAN | SD | MEAN | SD | T | P | |
| Length | 7.450 | 1.825 | 7.275 | 1.763 | –0.539 | .591 |
| Frequency | 2.319 | 1.075 | 2.373 | 1.130 | 0.265 | .791 |
[i] Note. In Experiment 2, the non-time category included 120 stimuli, while the time category had 40 stimuli (20 past- and 20 future-related; see Table 1).
Table 4
Descriptive statistics for time-related vs. non-related words in Experiment 3.
| TIME-RELATED WORDS | TIME NON-RELATED WORDS | COMPARISON (T-TEST) | ||||
|---|---|---|---|---|---|---|
| MEAN | SD | MEAN | SD | T | P | |
| Length | 7.450 | 1.825 | 7.550 | 1.853 | 0.243 | .809 |
| Frequency | 2.319 | 1.075 | 2.621 | 0.954 | 1.331 | .187 |
[i] Note. In Experiment 3, both the non-time and time categories included 40 stimuli, with the latter consisting of 20 past- and 20 future-related stimuli (see Table 1).