
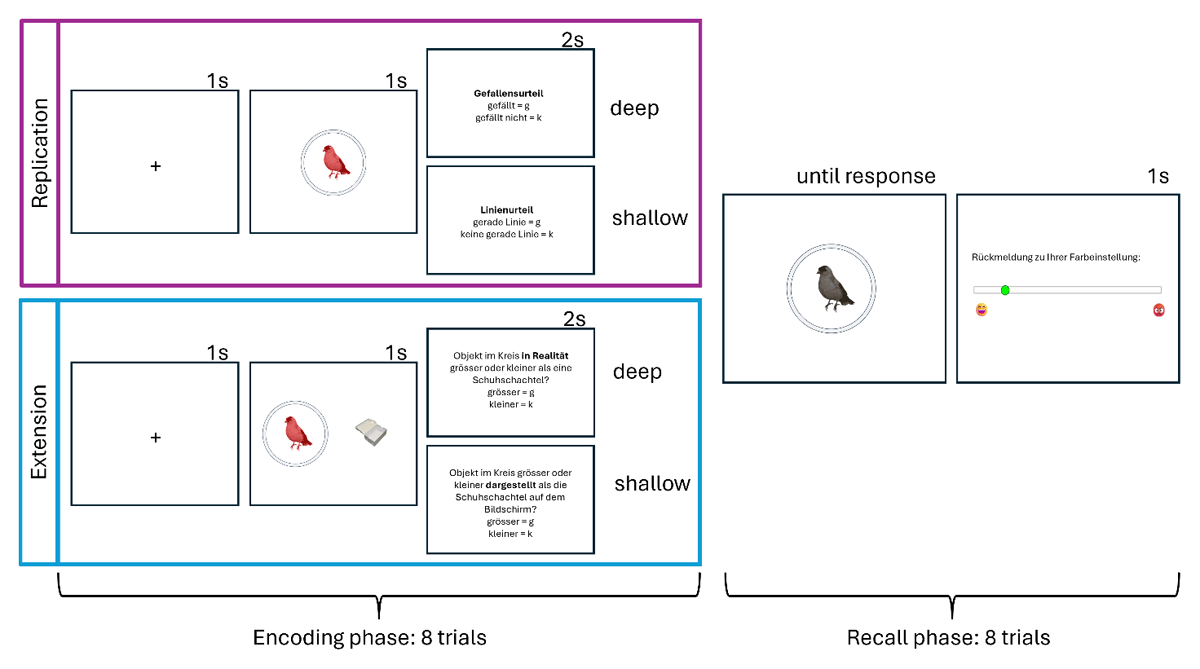
Figure 1
Example Encoding and Recall Trial.
Note. The encoding phase involved presenting the colored object in the middle of the screen (replication) or next to a reference object (extension condition) followed by a response prompt. In the replication condition, participants made a pleasantness judgment (pleasant = g, unpleasant = k) in the deep condition, and a line judgment (straight line = g, no straight line = k) in the shallow condition. In the extension condition, participants were asked: “Is the object in the circle larger or smaller than a shoebox in real life?” in the deep condition, and “Is the object shown in the circle larger or smaller than the shoebox on the screen?” in the shallow condition. They responded “bigger” by pressing “g” and “smaller” by pressing “k.” The recall phase, identical across all conditions, required participants to adjust the grayscale object’s color to match the encoded color. Feedback for the color setting was provided on a scale that indicated the degree of deviation between the participant’s adjusted color and the originally encoded color. This scale ranged from a happy emoji (low deviation) to an angry emoji (high deviation).
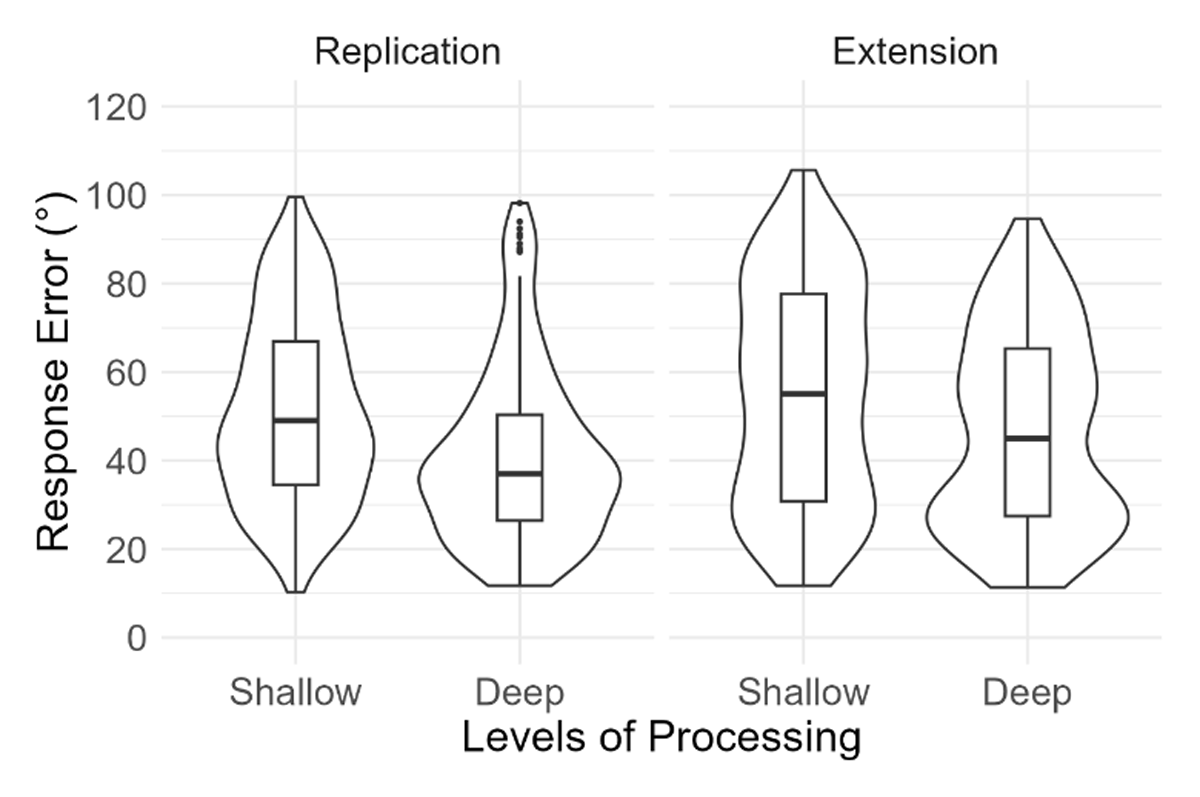
Figure 2
Response Error as a Function of Instructions (Replication, Extension) and Levels of Processing (Shallow, Deep).
Note. Lower values represent better performance. The violin plots indicate the density of the data. The horizontal line inside each box plot indicates median performance (i.e., 50th percentile). The lower and upper ends of each box represent the 25th and 75th percentiles, enclosing the interquartile range. The whiskers extend to 1.5 times the interquartile range from either end of the box. The points outside the whiskers of the boxplot are outliers. Spearman-Brown corrected reliability estimates with 95% confidence intervals were calculated for each condition using 5000 random splits with the R package splithalf (Parsons, 2021). Results indicated good reliability: Replication-shallow = 0.82 [0.78, 0.86], Replication-deep = 0.86 [0.83, 0.89], Extension-shallow = 0.88 [0.85, 0.91], Extension-deep = 0.87 [0.84, 0.90].
Table 1
Number of Participants Indicating Experienced Task Easiness and Verbalization Strategy Use in the Posttest Questionnaire.
| QUESTION | REPLICATION | EXTENSION |
|---|---|---|
| Task Easiness | n | n |
| deep | 97 (61%) | 81 (54%) |
| shallow | 5 (3%) | 13 (9%) |
| indifferent | 56 (35%) | 55 (37%) |
| Verbalization Strategy | ||
| both | 83 (53%) | 79 (53%) |
| color | 16 (10%) | 20 (13%) |
| object | 10 (6%) | 8 (5%) |
| none | 49 (31%) | 42 (28%) |