
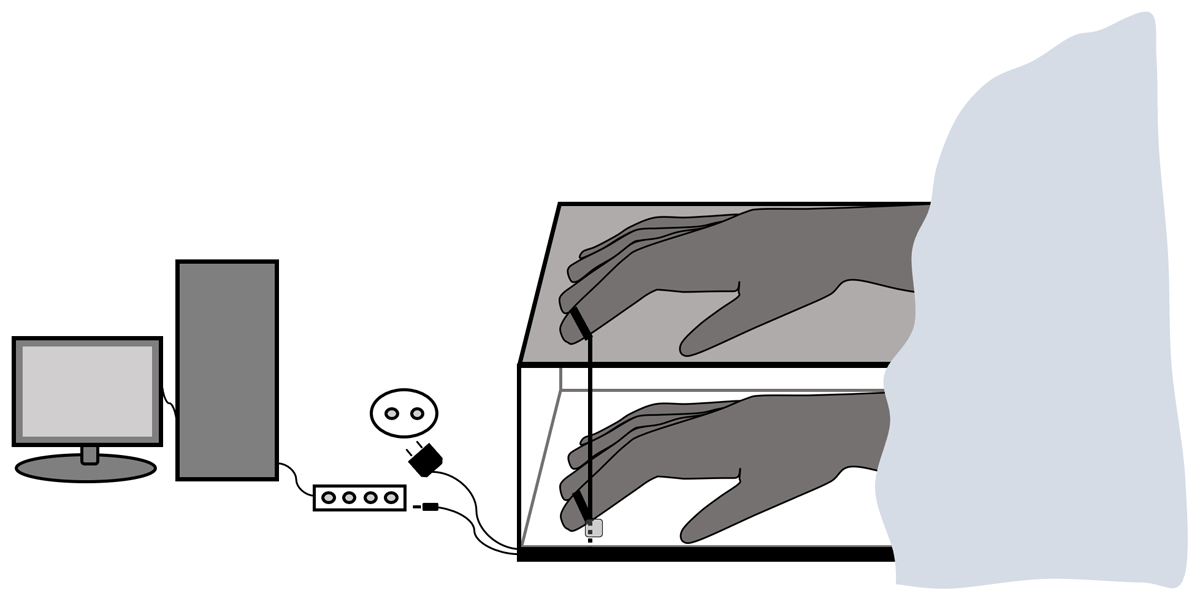
Figure 1
Illustration of the apparatus.
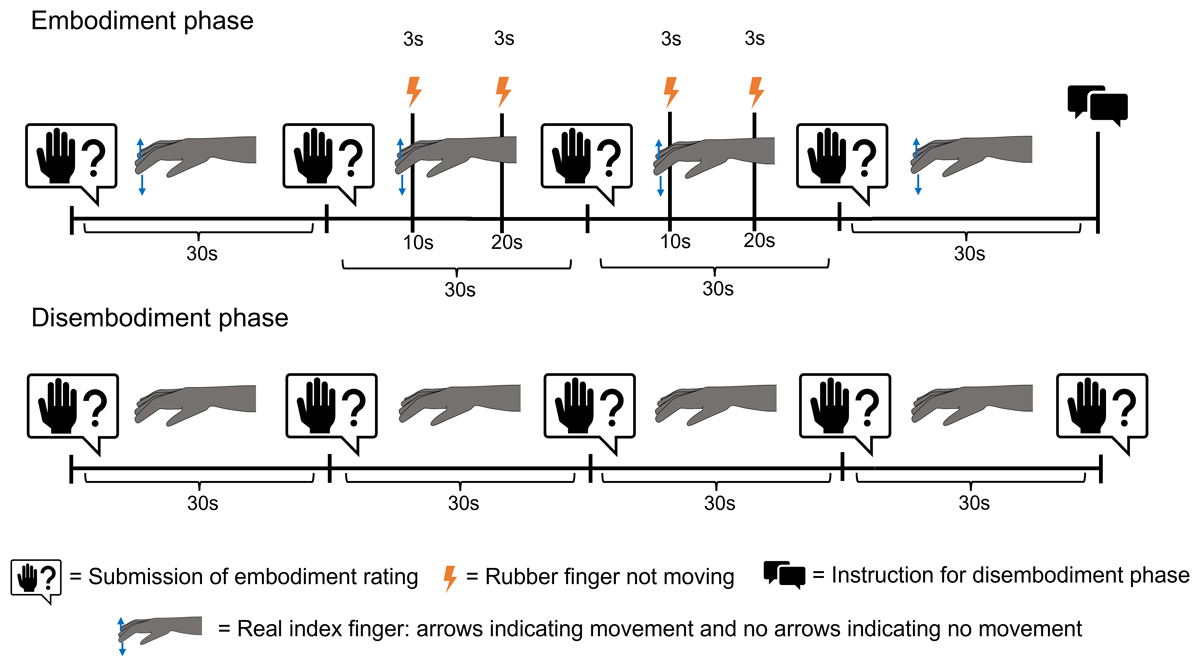
Figure 2
Timeline of events for one trial of the intermittent condition in Experiment 1.
Note: The figure illustrates events during one trial of the intermittent condition. Corresponding visual events on the rubber hand were congruent with actions of the real hand most of the time. Interruptions of contingency between action and effect are indicated by the flash icon. The intermittent and continuous condition only differed with respect to these interruptions: while present in the intermittent condition, they were absent in the continuous condition.
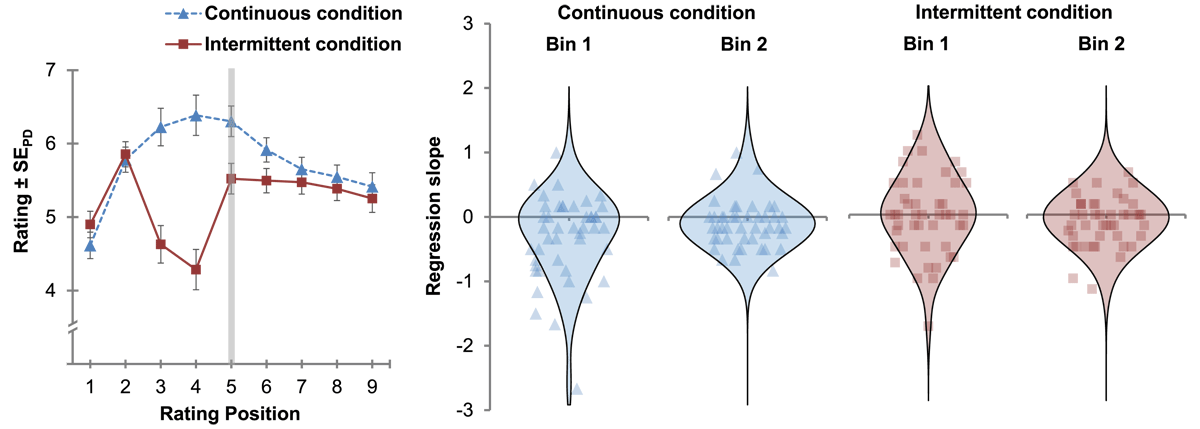
Figure 3
Left panel: Mean embodiment ratings for embodiment and disembodiment phase of Experiment 1 as a function of rating position and condition. Right panel: Violin plots of the distribution of individual regression slopes across participants for the first and second time bin of the disembodiment phase for each condition.
Note: The vertical grey line at the 5th rating position of the left panel represents the transition from the embodiment phase to the disembodiment phase. Error bars indicate standard errors (±1 SE) of paired differences between the continuous and the intermittent condition (Pfister & Janczyk, 2013).
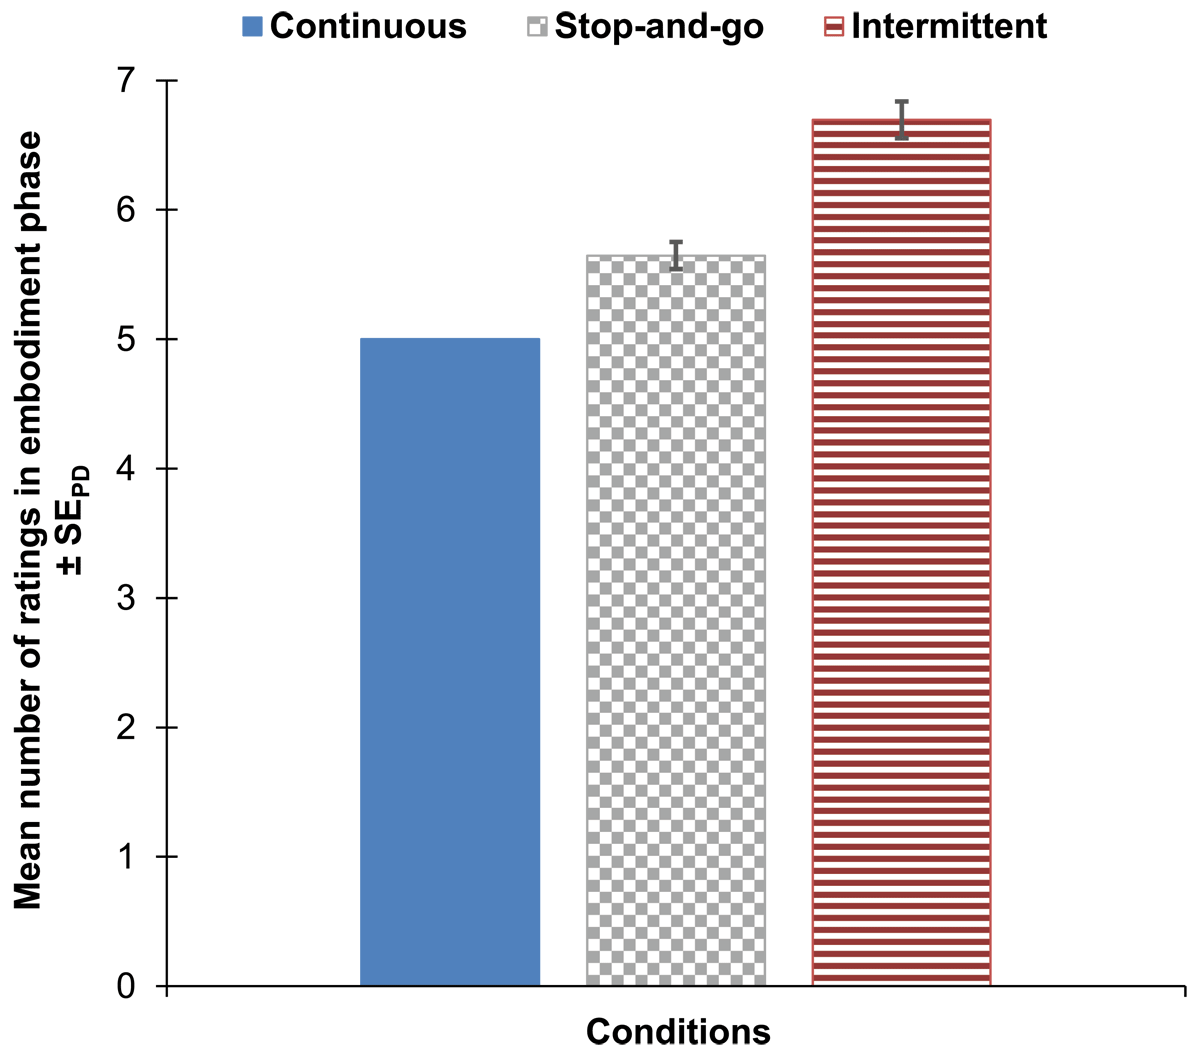
Figure 4
Mean number of ratings in embodiment phase of Experiment 2 for each condition.
Note: Ratings were collected every 30 seconds. Therefore, the number of ratings represents the duration of the embodiment phase because with each additional rating the embodiment phase was extended for 30 seconds. For the stop-and-go condition (bar with grey squares pattern), error bars indicate standard errors (±1 SE) of paired differences between the stop-and-go and the continuous condition. For the intermittent condition (bar with red lines pattern), error bars indicate standard errors (±1 SE) of paired differences between the intermittent and the stop-and-go condition (Pfister & Janczyk, 2013).
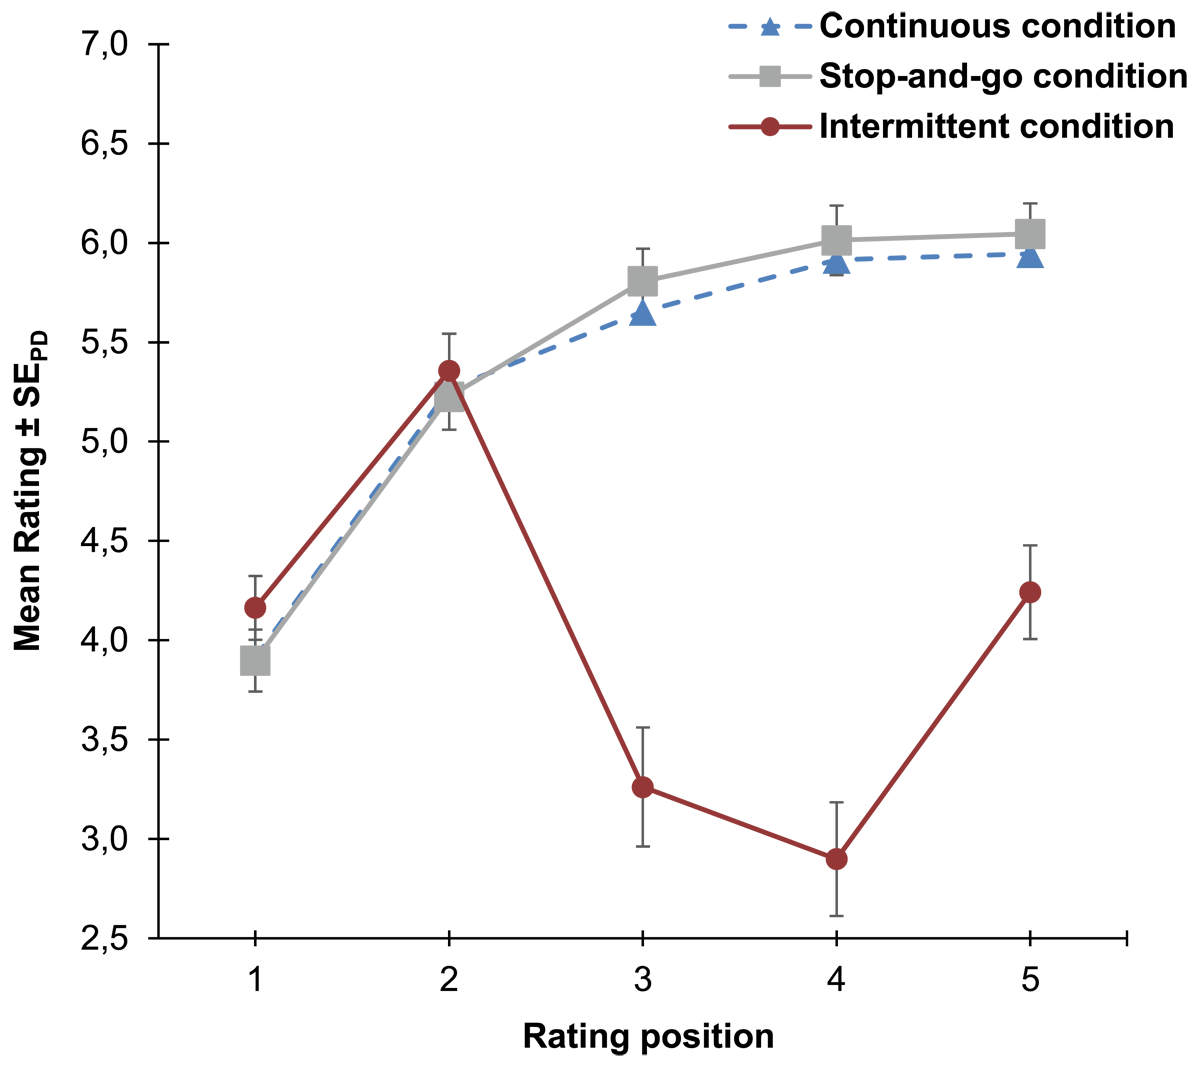
Figure 5
Mean ratings for the first five rating positions of the embodiment phase for each condition of Experiment 2.
Note: For the stop-and-go condition (line with grey squares), error bars indicate standard errors (±1 SE) of paired differences between the stop-and-go and the continuous condition. For the intermittent condition (line with red circles), error bars indicate standard errors (±1 SE) of paired differences between the intermittent and the continuous condition (Pfister & Janczyk, 2013).
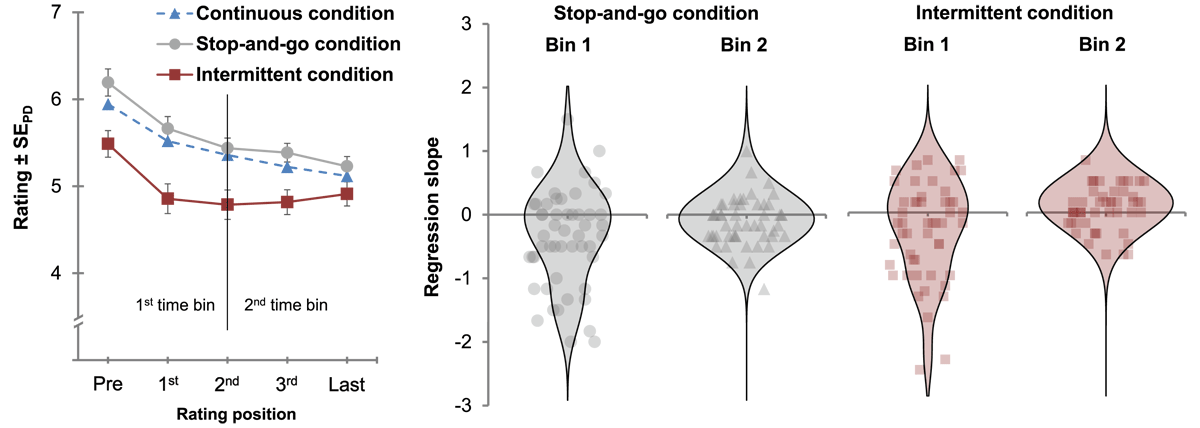
Figure 6
Left panel: Mean embodiment ratings as a function of rating position and condition for the disembodiment phase of Experiment 2 Right panel: Violin plots of the distribution of individual regression slopes across participants for the stop-and-go condition and the intermittent condition.
Note: The “Pre”-rating is the last rating of the embodiment phase. For the stop-and-go condition, error bars indicate standard errors (±1 SE) of paired differences between the stop-and-go and the continuous condition. For the intermittent condition, error bars indicate standard errors (±1 SE) of paired differences between the intermittent and the continuous condition (Pfister & Janczyk, 2013).