
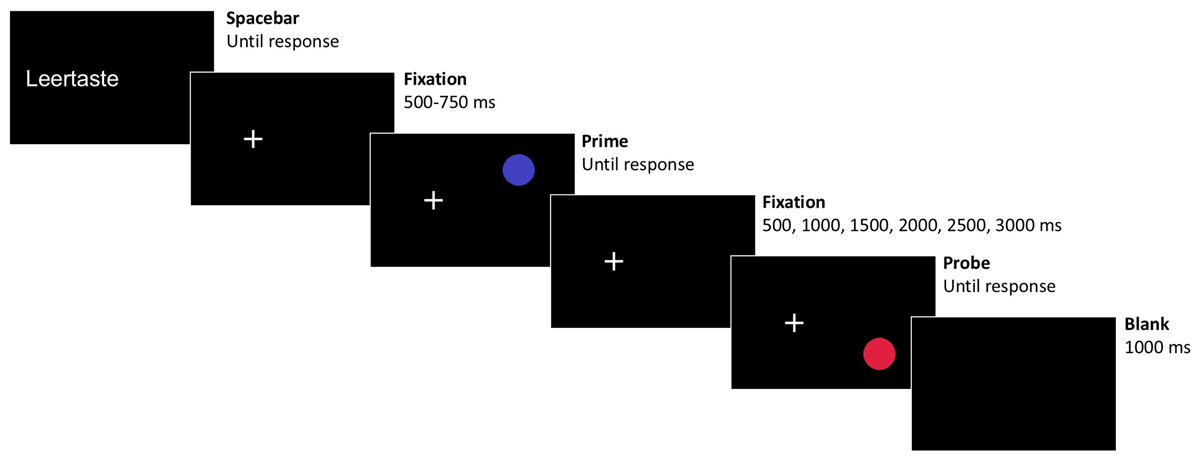
Figure 1
An exemplary trial sequence (not drawn-to-scale), depicting a trial with both the color – and by that the response – and location changing.
Table 1
Mean reaction times in milliseconds and error rates in percent (in brackets) of probe responses for each condition and RSI, separate for Experiment 1 and Experiment 2. RR = Response repetition, RC = Response change, LR = Location repetition, LC = Location change.
| EXPERIMENT | RSI | RRLR | RRLC | RCLR | RCLC |
|---|---|---|---|---|---|
| Experiment 1 | 500 | 472 (0.51) | 492 (2.71) | 549 (5.74) | 518 (2.03) |
| 1000 | 468 (1.73) | 490 (2.96) | 528 (6.93) | 504 (1.96) | |
| 1500 | 479 (2.60) | 497 (4.26) | 529 (4.74) | 508 (2.63) | |
| 2000 | 497 (2.36) | 502 (6.00) | 528 (4.37) | 513 (3.19) | |
| 2500 | 490 (3.82) | 507 (5.96) | 522 (4.48) | 509 (4.25) | |
| 3000 | 498 (3.39) | 507 (5.52) | 516 (5.72) | 511 (3.62) | |
| Experiment 2 | 500 | 400 (0.51) | 439 (4.99) | 474 (8.55) | 428 (1.12) |
| 1000 | 422 (1.18) | 444 (5.14) | 480 (6.69) | 440 (2.01) | |
| 1500 | 450 (1.53) | 471 (4.45) | 499 (4.50) | 472 (2.35) | |
| 2000 | 479 (2.89) | 486 (5.41) | 505 (4.12) | 482 (2.78) | |
| 2500 | 474 (2.33) | 496 (4.82) | 511 (3.83) | 488 (3.99) | |
| 3000 | 490 (3.72) | 507 (4.80) | 509 (5.46) | 498 (3.32) |
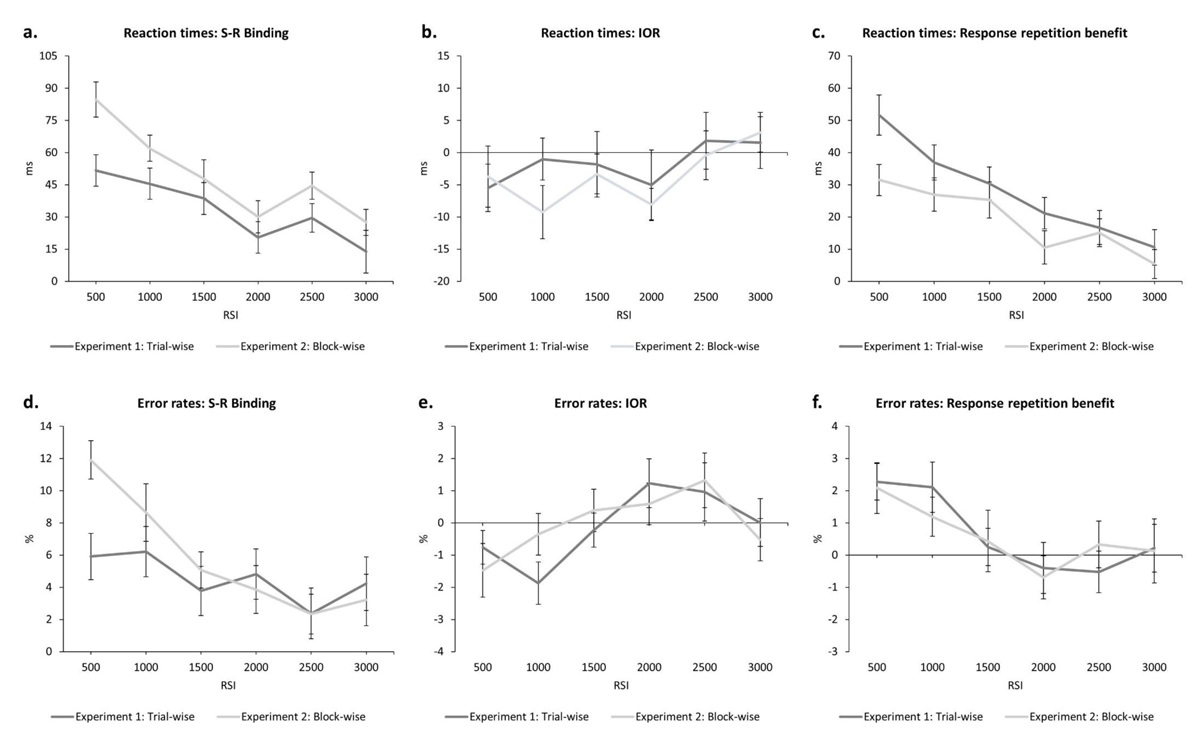
Figure 2
a) The calculated S-R binding effects depending on RSI in reaction times. b) The calculated IOR effects depending on RSI in reaction times. c) The calculated response repetition benefit depending on RSI in reaction times. d) The calculated S-R binding effects depending on RSI in error rates. e) The calculated IOR effects depending on RSI in error rates. f) The calculated response repetition benefit depending on RSI in error rates. The dark grey lines depict the results of Experiment 1 (trial-wise presentation of RSI) and the light grey lines depict the results of Experiment 2 (block-wise presentation of RSI). All error bars represent standard error of each mean.
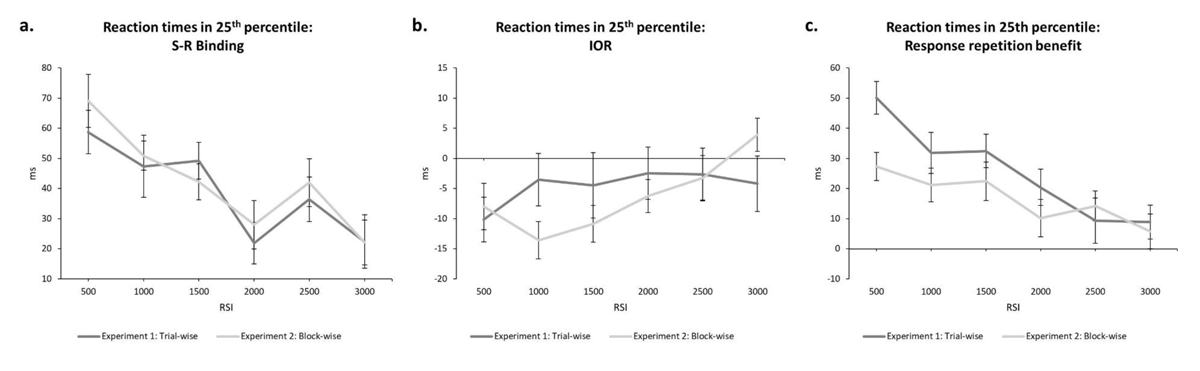
Figure 3
a) The calculated S-R binding effects depending on RSI in reaction times in the 25th percentile rank. b) The calculated IOR effects depending on RSI in reaction times in the 25th percentile rank. c) The calculated response repetition benefit depending on RSI in reaction times in the 25th percentile rank. The dark grey lines depict the results of Experiment 1 (trial-wise presentation of RSI) and the light grey lines depict the results of Experiment 2 (block-wise presentation of RSI). All error bars represent standard error of each mean.
| EXPERIMENT | EFFECT | RSI | M | SD | t(1, 29) | p | d |
|---|---|---|---|---|---|---|---|
| Experiment 1 | S-R Binding | 500 | 52 | 40 | 7.04 | <.001 | 1.29 |
| 1000 | 45 | 40 | 6.21 | <.001 | 1.13 | ||
| 1500 | 39 | 41 | 5.21 | <.001 | 0.95 | ||
| 2000 | 20 | 40 | 2.80 | .009 | 0.51 | ||
| 2500 | 30 | 36 | 4.45 | <.001 | 0.81 | ||
| 3000 | 14 | 54 | 1.39 | <.001 | 0.25 | ||
| IOR | 500 | –5 | 20 | –1.49 | .147 | 0.27 | |
| 1000 | –1 | 18 | –0.31 | .760 | 0.06 | ||
| 1500 | –2 | 28 | –0.36 | .720 | 0.07 | ||
| 2000 | –5 | 30 | –0.92 | .364 | 0.17 | ||
| 2500 | 2 | 24 | 0.42 | .679 | 0.08 | ||
| 3000 | 2 | 22 | 0.38 | .705 | 0.07 | ||
| RRB | 500 | 52 | 34 | 8.21 | <.001 | 1.50 | |
| 1000 | 37 | 30 | 6.79 | <.001 | 1.24 | ||
| 1500 | 30 | 28 | 5.94 | <.001 | 1.08 | ||
| 2000 | 21 | 27 | 4.36 | <.001 | 0.80 | ||
| 2500 | 17 | 29 | 3.15 | .004 | 0.57 | ||
| 3000 | 11 | 30 | 1.90 | .067 | 0.35 | ||
| Experiment 2 | S-R Binding | 500 | 85 | 45 | 10.35 | <.001 | 1.89 |
| 1000 | 62 | 33 | 10.20 | <.001 | 1.86 | ||
| 1500 | 48 | 49 | 5.36 | <.001 | 0.98 | ||
| 2000 | 30 | 41 | 3.99 | <.001 | 0.73 | ||
| 2500 | 45 | 34 | 7.10 | <.001 | 1.30 | ||
| 3000 | 27 | 33 | 4.50 | <.001 | 0.82 | ||
| IOR | 500 | –4 | 26 | –0.78 | .441 | 0.14 | |
| 1000 | –9 | 23 | –2.23 | .034 | 0.41 | ||
| 1500 | –3 | 17 | –1.08 | .289 | 0.20 | ||
| 2000 | –8 | 14 | –3.23 | .003 | 0.59 | ||
| 2500 | 0 | 21 | –0.11 | .914 | 0.02 | ||
| 3000 | 3 | 17 | 1.02 | .318 | 0.19 | ||
| RRB | 500 | 31 | 26 | 6.52 | <.001 | 1.19 | |
| 1000 | 27 | 28 | 5.21 | <.001 | 0.95 | ||
| 1500 | 25 | 31 | 4.51 | <.001 | 0.82 | ||
| 2000 | 10 | 28 | 2.02 | .052 | 0.37 | ||
| 2500 | 15 | 24 | 3.49 | .002 | 0.64 | ||
| 3000 | 5 | 25 | 1.20 | .240 | 0.22 |
| EXPERIMENT | EFFECT | RSI | M | SD | t(1, 29) | p | d |
|---|---|---|---|---|---|---|---|
| Experiment 1 | S-R Binding | 500 | 5.91 | 7.90 | 4.10 | <.001 | 0.75 |
| 1000 | 6.21 | 8.54 | 3.98 | <.001 | 0.73 | ||
| 1500 | 3.77 | 8.33 | 2.48 | .019 | 0.45 | ||
| 2000 | 4.82 | 8.57 | 3.08 | .005 | 0.56 | ||
| 2500 | 2.37 | 8.59 | 1.51 | .141 | 0.28 | ||
| 3000 | 4.23 | 9.14 | 2.53 | .017 | 0.46 | ||
| IOR | 500 | –0.76 | 2.88 | –1.45 | .158 | 0.27 | |
| 1000 | –1.87 | 3.61 | –2.84 | .008 | 0.52 | ||
| 1500 | –0.23 | 2.89 | –0.43 | .669 | 0.08 | ||
| 2000 | 1.23 | 4.16 | 1.62 | .116 | 0.30 | ||
| 2500 | 0.96 | 4.95 | 1.06 | .298 | 0.19 | ||
| 3000 | 0.01 | 4.05 | 0.01 | .989 | 0.00 | ||
| RRB | 500 | 2.27 | 3.10 | 4.02 | <.001 | 0.73 | |
| 1000 | 2.10 | 4.28 | 2.69 | .012 | 0.49 | ||
| 1500 | 0.26 | 3.17 | 0.44 | .661 | 0.08 | ||
| 2000 | –0.40 | 4.35 | –0.51 | .618 | 0.09 | ||
| 2500 | –0.53 | 3.56 | –0.81 | .426 | 0.15 | ||
| 3000 | 0.21 | 4.08 | 0.29 | .777 | 0.05 | ||
| Experiment 2 | S-R Binding | 500 | 11.91 | 6.52 | 10.01 | <.001 | 1.83 |
| 1000 | 8.64 | 9.77 | 4.84 | <.001 | 0.88 | ||
| 1500 | 5.07 | 6.14 | 4.52 | <.001 | 0.83 | ||
| 2000 | 3.85 | 8.13 | 2.60 | .015 | 0.47 | ||
| 2500 | 2.33 | 6.77 | 1.89 | .069 | 0.35 | ||
| 3000 | 3.22 | 8.75 | 2.01 | .053 | 0.37 | ||
| IOR | 500 | –1.48 | 4.55 | –1.78 | .086 | 0.33 | |
| 1000 | –0.36 | 3.54 | –0.56 | .582 | 0.10 | ||
| 1500 | 0.38 | 3.59 | 0.59 | .562 | 0.11 | ||
| 2000 | 0.59 | 3.55 | 0.91 | .373 | 0.17 | ||
| 2500 | 1.32 | 4.63 | 1.56 | .129 | 0.29 | ||
| 3000 | –0.52 | 3.61 | –0.80 | .432 | 0.15 | ||
| RRB | 500 | 2.08 | 4.31 | 2.65 | .013 | 0.48 | |
| 1000 | 1.19 | 3.34 | 1.95 | .061 | 0.36 | ||
| 1500 | 0.43 | 5.23 | 0.45 | .653 | 0.08 | ||
| 2000 | –0.70 | 3.66 | –1.04 | .307 | 0.19 | ||
| 2500 | 0.33 | 3.96 | 0.46 | .648 | 0.08 | ||
| 3000 | 0.13 | 5.47 | 0.13 | .897 | 0.02 |