
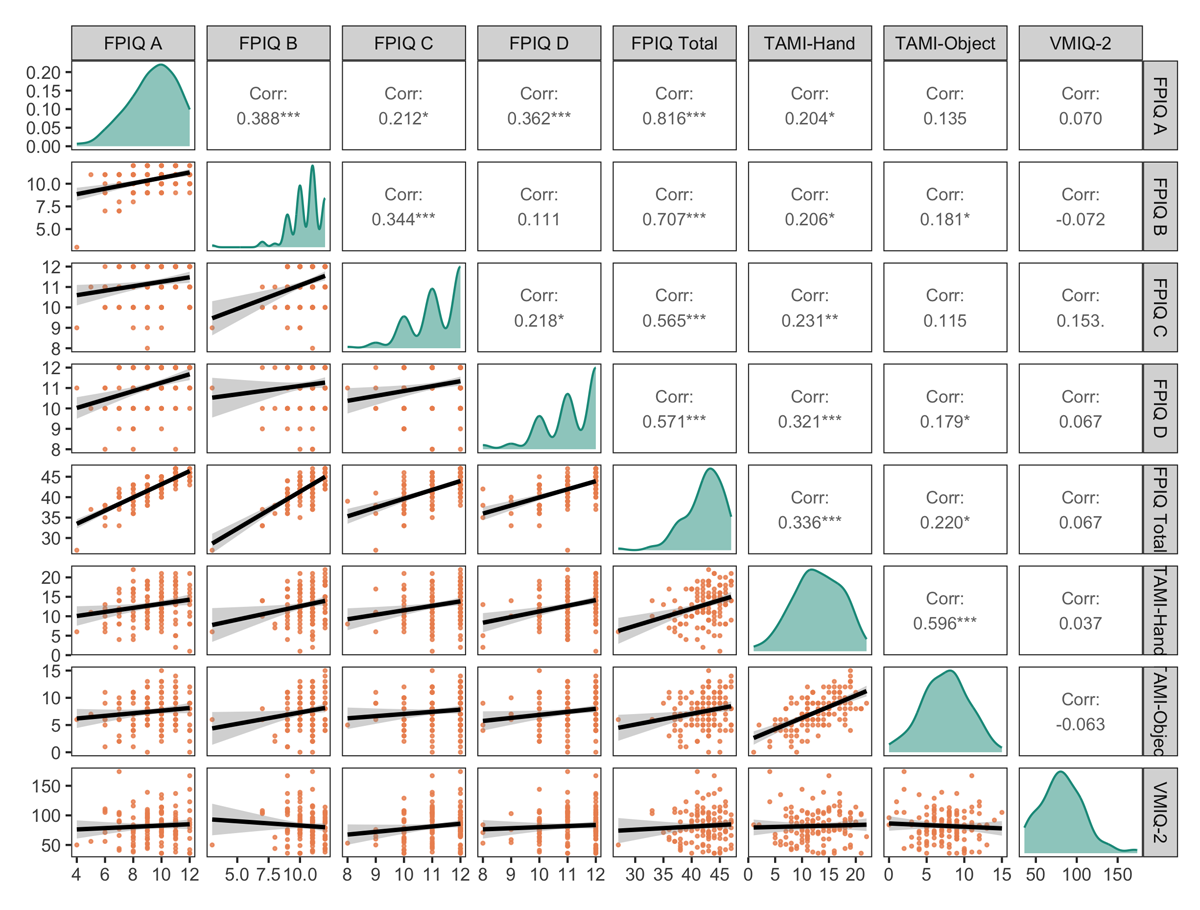
Figure 1
Distributions and Correlations of Motor Imagery Individual Difference Measures.
Note. FPIQ = Florida Praxis Imagery Questionnaire; TAMI = Test of Ability in Movement Imagery; VMIQ-2 = Vividness of Movement Imagery Questionnaire 2.
Table 1
Linear Mixed Effect Models Predicting Graspability Ratings.
| RATING (OVER/UNDERESTIMATE) | RATING (ABSOLUTE DIFFERENCE) | |||||
|---|---|---|---|---|---|---|
| PREDICTORS | B | CI | P | B | CI | P |
| (Intercept) | 0.92 | [–0.95, 2.79] | .335 | 1.59 | [0.96, 2.22] | <.001 |
| FPIQ A (Kinesthetic) | –0.05 | [–0.13, 0.02] | .170 | 0.01 | [–0.02, 0.03] | .582 |
| FPIQ B (Position) | 0.01 | [–0.09, 0.11] | .854 | –0.02 | [–0.05, 0.02] | .354 |
| FPIQ C (Action) | 0.02 | [–0.13, 0.16] | .818 | 0.01 | [–0.04, 0.06] | .752 |
| FPIQ D (Object) | –0.08 | [–0.21, 0.05] | .232 | –0.01 | [–0.06, 0.03] | .611 |
| TAMI – Hand | 0.01 | [–0.03, 0.04] | .749 | –0.01 | [–0.02, 0.00] | .074 |
| TAMI – Object | –0.03 | [–0.08, 0.01] | .147 | 0.01 | [–0.01, 0.02] | .527 |
| VMIQ-2 | 0.00 | [–0.00, 0.01] | .064 | –0.00 | [–0.00, –0.00] | .002 |
| Handedness Quotient | 0.00 | [–0.00, 0.00] | .778 | –0.00 | [–0.00, 0.00] | .302 |
| Random Effects | ||||||
| Residual | 2.12 | 1.18 | ||||
| Participant Intercept | 0.41 | 0.04 | ||||
| Observations | 45460 | 45460 | ||||
| Marginal R2/Conditional R2 | 0.015/0.176 | 0.006/0.042 | ||||
[i] Note. CI = confidence interval; FPIQ = Florida Praxis Imagery Questionnaire; TAMI = Test of Ability in Movement Imagery; VMIQ-2 = Vividness of Movement Imagery Questionnaire 2. The marginal R2 includes only the variance from the fixed effects and the conditional R2 includes variance from both the fixed and random effects. The model equations were: Rating ~ FPIQ A + FPIQ B + FPIQ C + FPIQ D + TAMI-Hand + TAMI-Object + VMIQ-2 + Handedness Quotient + (1|Participant). p-values for fixed effects in the linear mixed effects model are calculated using Satterthwaite’s method. N participants = 130.

Figure 2
VMIQ-2 Relationship to Graspability Ratings Differences.
Note. VMIQ-2 = Vividness of Movement Imagery Questionnaire 2. Points represent observed data, shading around the regression line represents the lower and upper 95% confidence limits. Lower VMIQ-2 scores indicate more vivid imagery.