
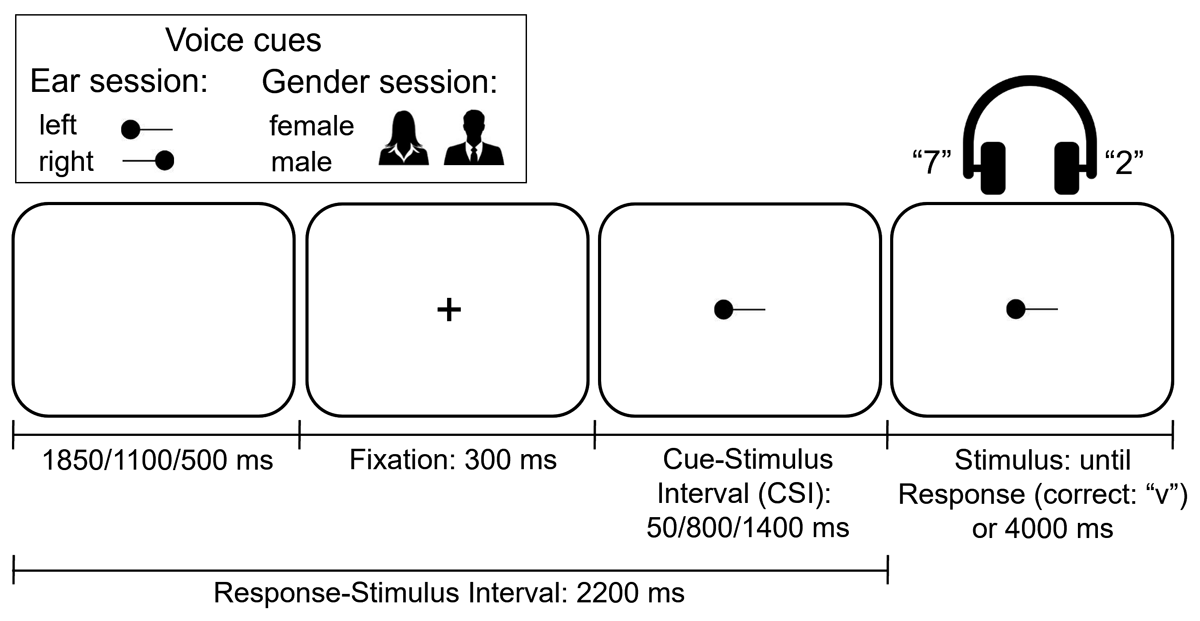
Figure 1
The Cues Used in the Two Experimental Sessions and the Temporal Structure of a Trial (Illustrated for the Ear Session).
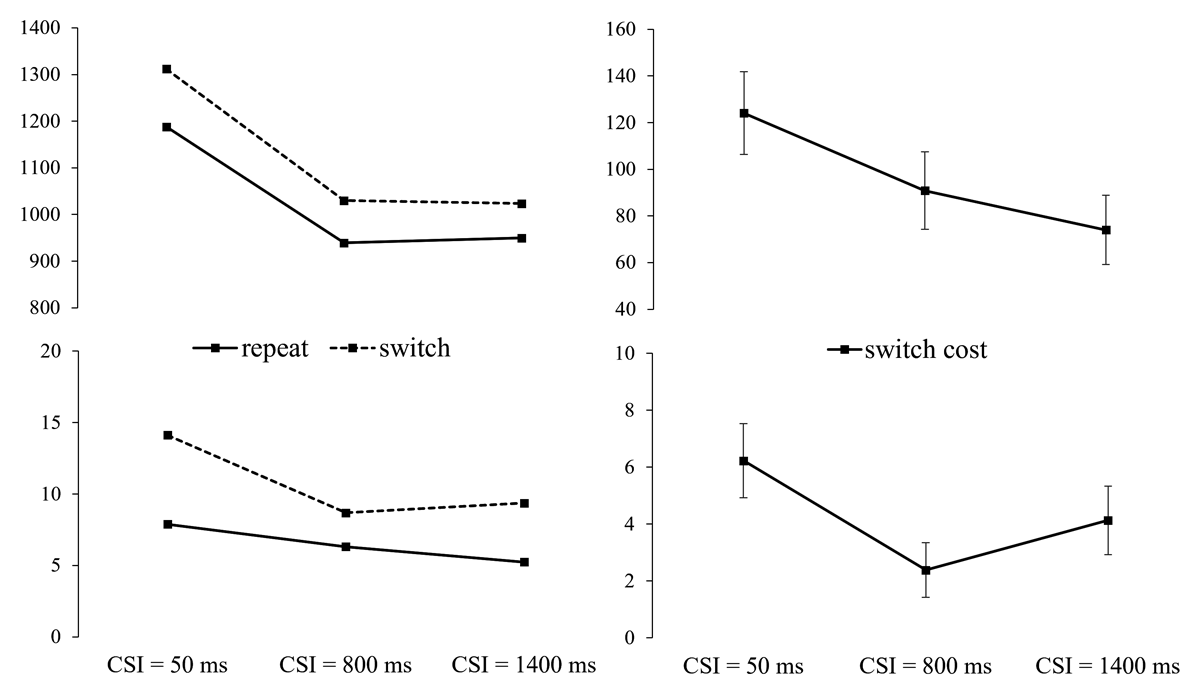
Figure 2
Left: RT and Errors for the Ear Session, as a Function of Cued Ear (Side) Switch vs. Repeat and CSI. Right: RT and Error Switch Costs (with SEs) as a function of CSI.5
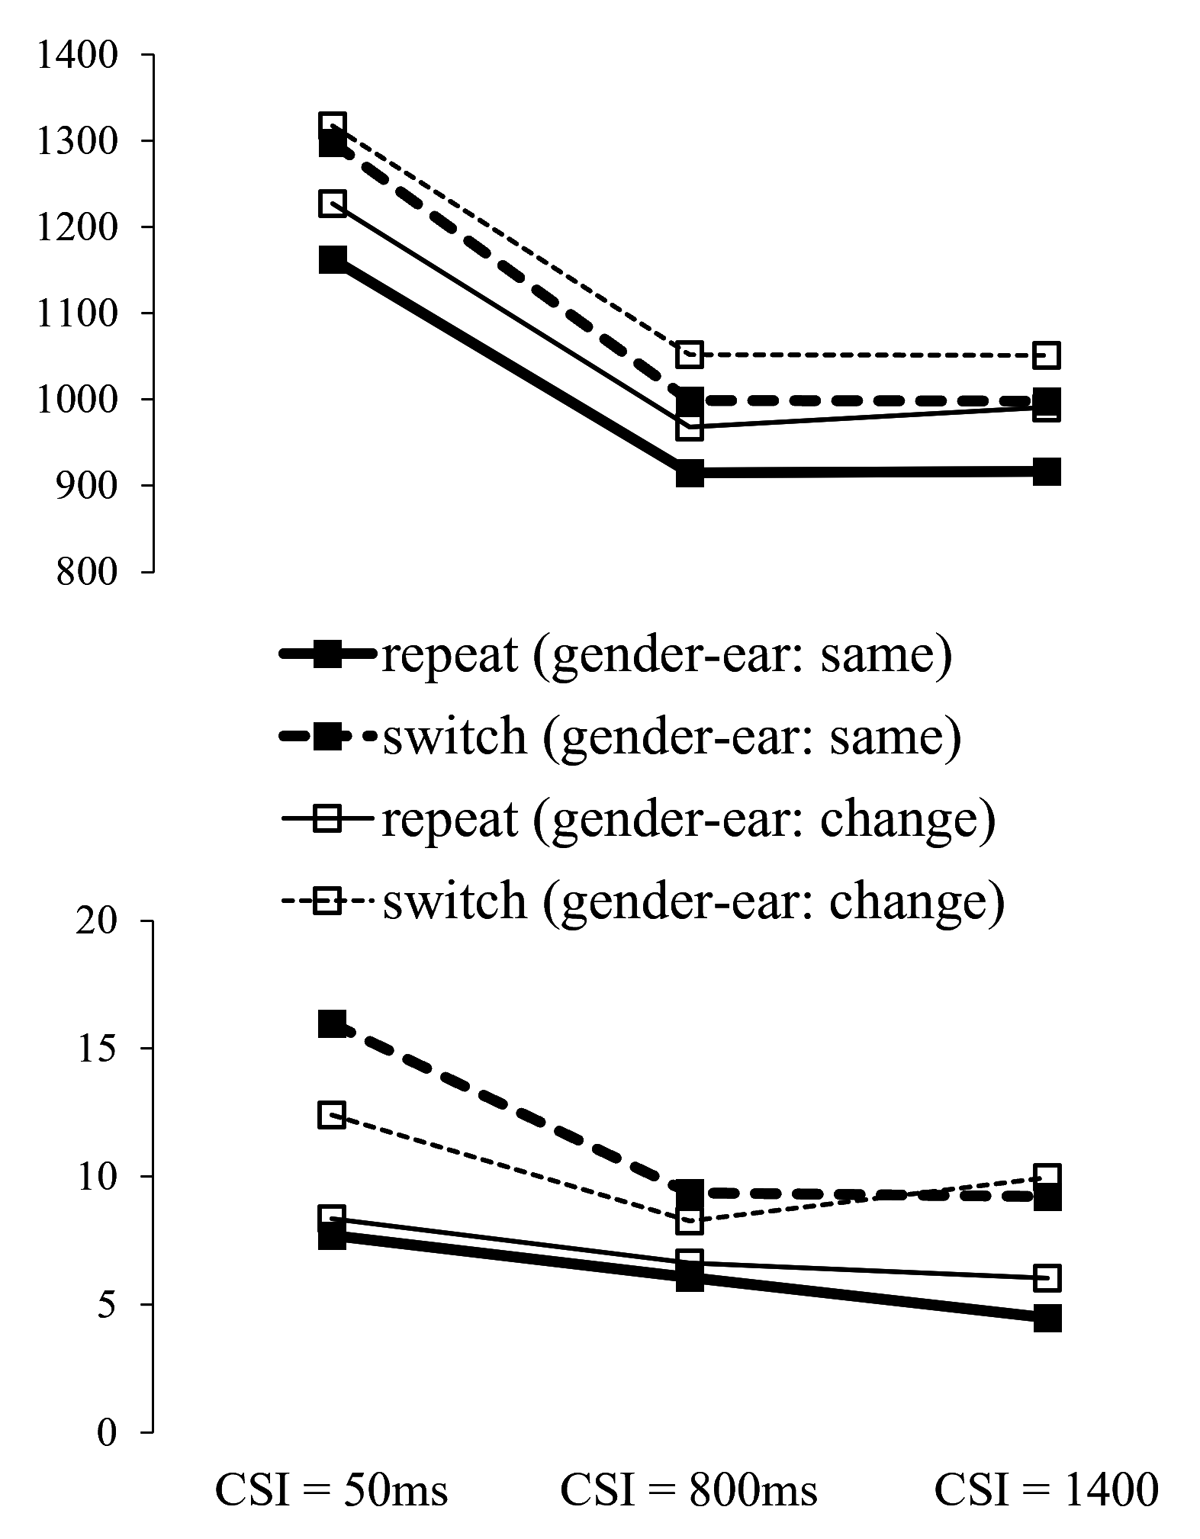
Figure 3
RT and Error Rate for the Ear Session, as a Function of Cued Ear (Side) Switch vs. Repeat, CSI and Gender-Ear Mapping Transition (the Same or Changed Relative to Trial n–1).
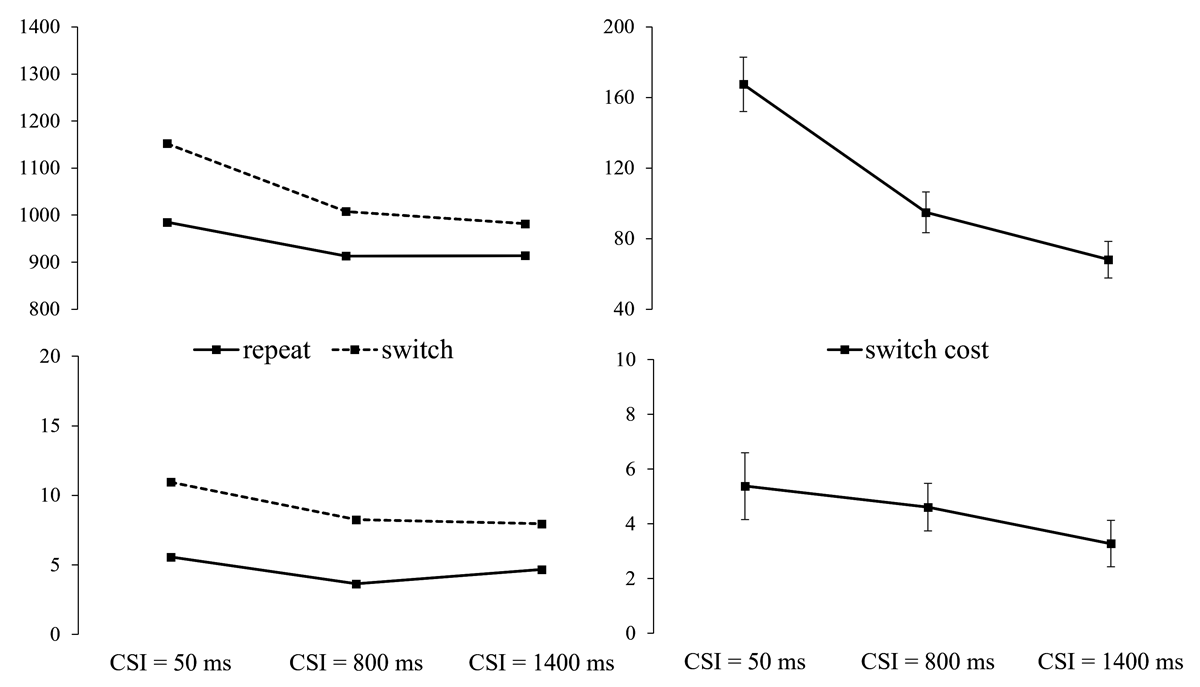
Figure 4
Left: RT (in ms) and Error Rate (%) from Experiment 1, Gender Session, as a Function of Cued Gender Switch vs. Repeat and CSI. Right: RT and Error Switch Costs (± SE) by CSI.
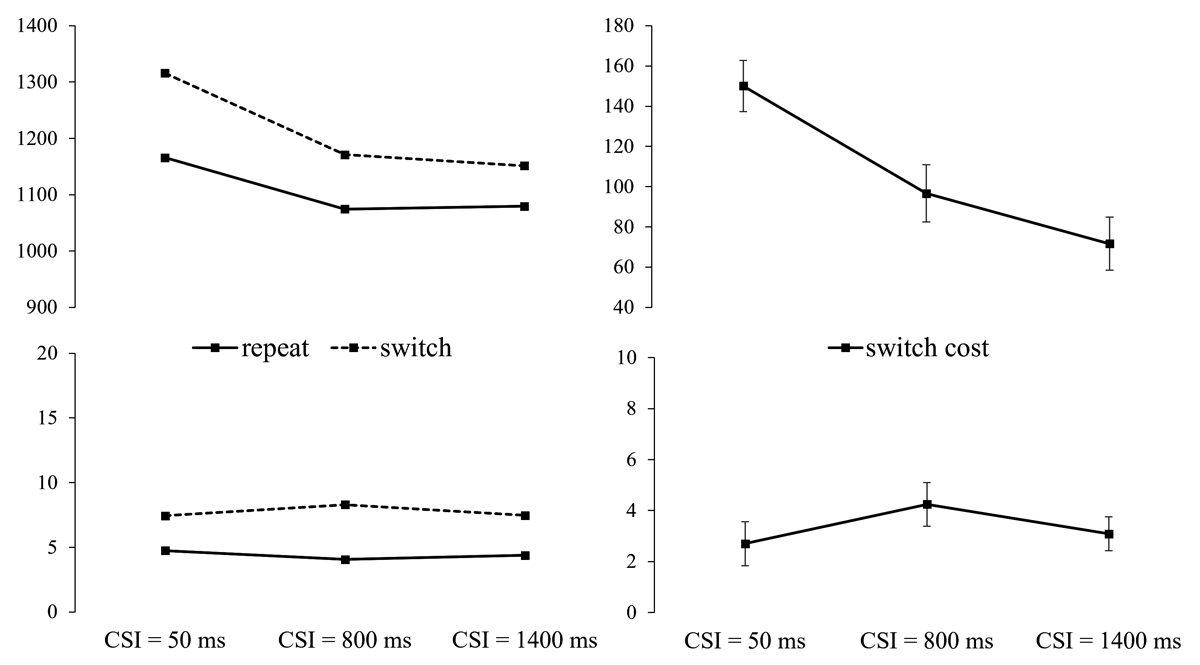
Figure 5
Left: RT and Error Rate from Experiment 2 as a Function of Cued Gender Switch vs. Repeat and CSI. Right: RT and Error Switch Costs (with SEs) by CSI.
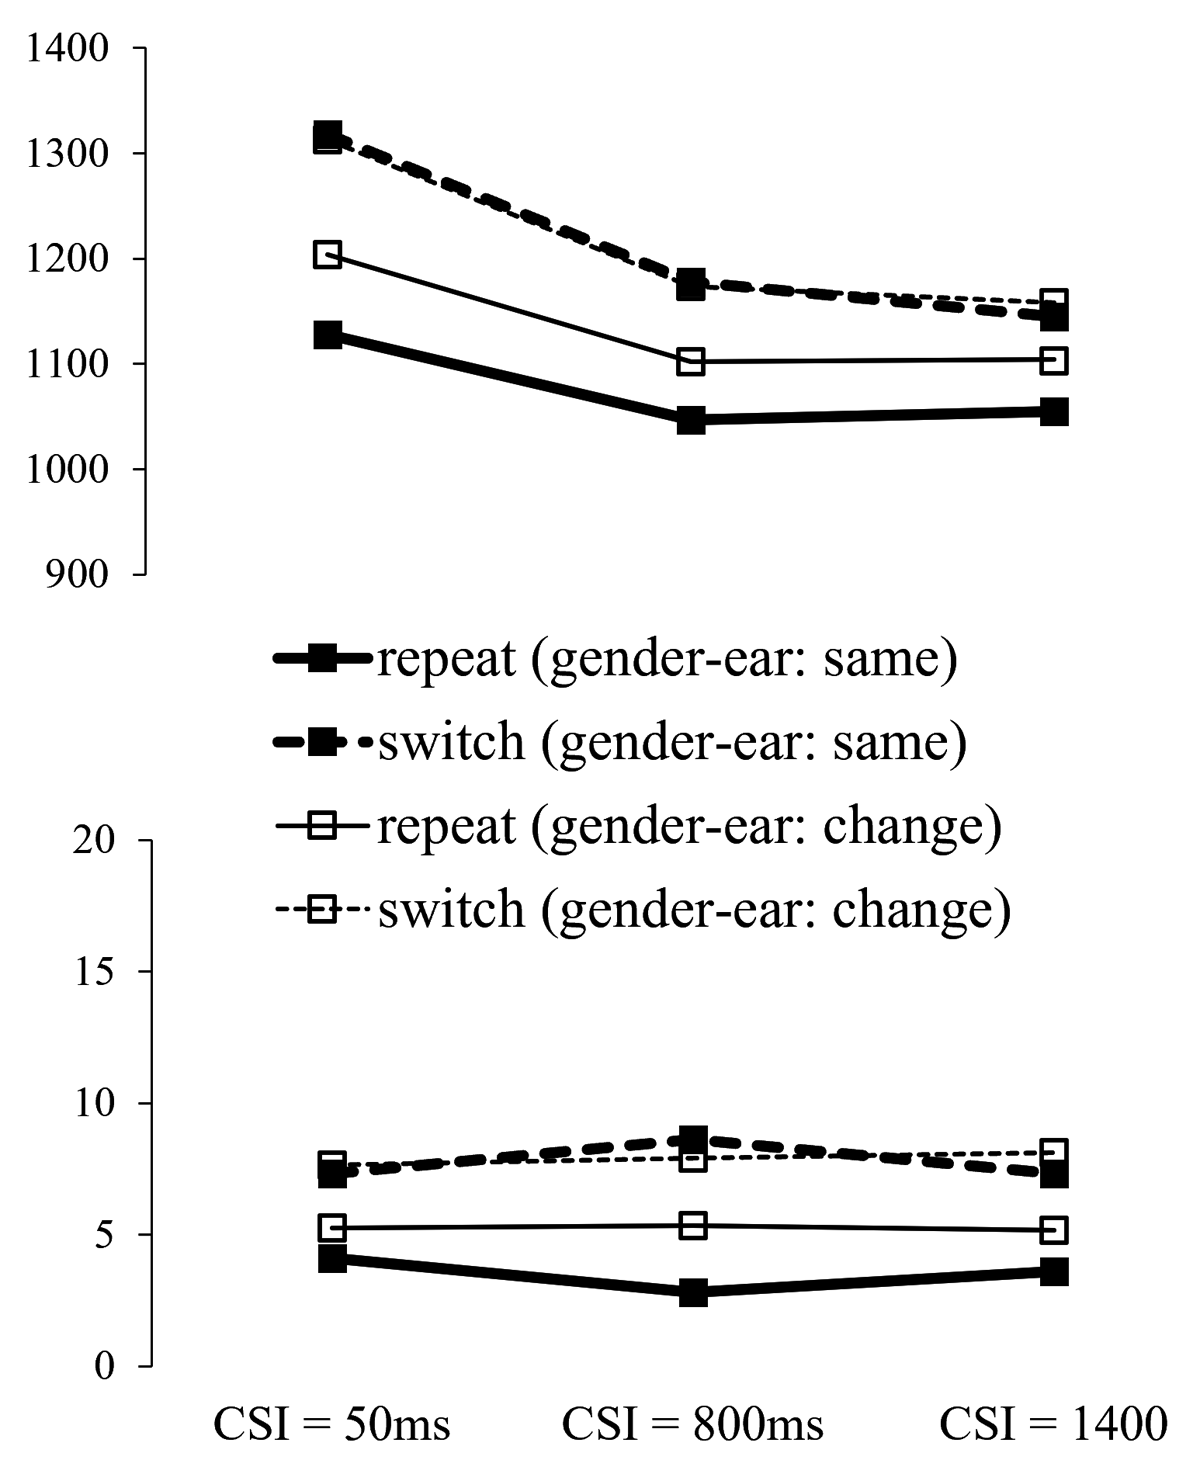
Figure 6
RT and Error Rate from Experiment 2 by Cued Gender Switch vs. Repeat, CSI and the Gender-Ear Mapping Transition.