
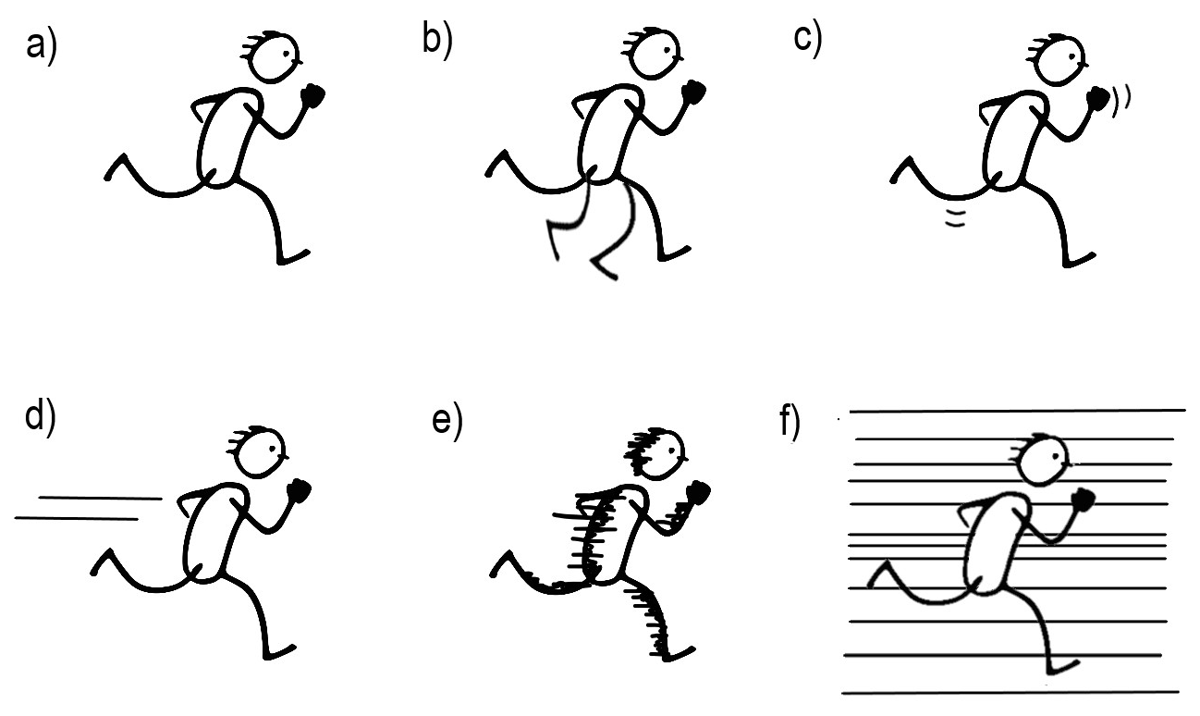
Figure 1
Lexical items that give a sense of movement in two-dimensional images a) postural cue b) repetition of (parts of) the mover c) contour lines mimicking the mover’s contours d) motion lines trailing behind the mover e) suppletion lines covering parts of the mover f) backfixing lines set in the background, behind the mover (Hacımusaoğlu & Cohn, 2023).
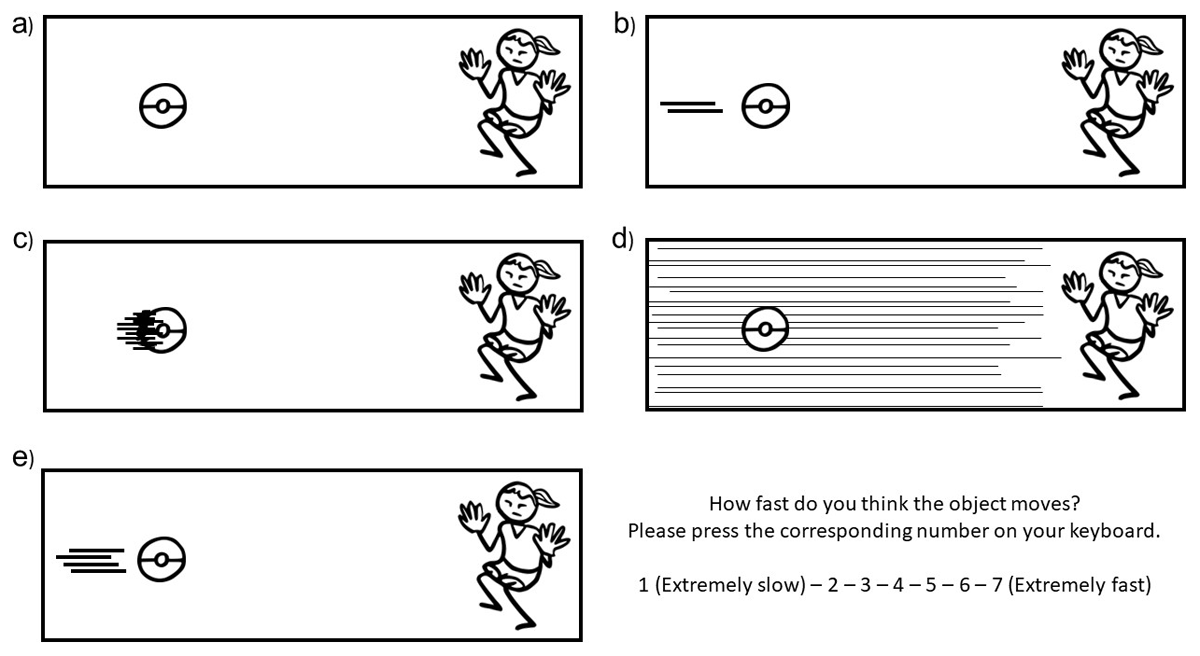
Figure 2
Motion cues of a) object-only condition where no additional cue appeared to indicate motion on the object itself b) motion lines as two parallel straight lines trailing behind the mover c) suppletion lines d) backfixing lines (in Experiments 1 and 2) and e) several motion lines (Experiment 2). Each panel comes with the rating question in the original trials. Stimuli were adapted from CocoMaterial images.
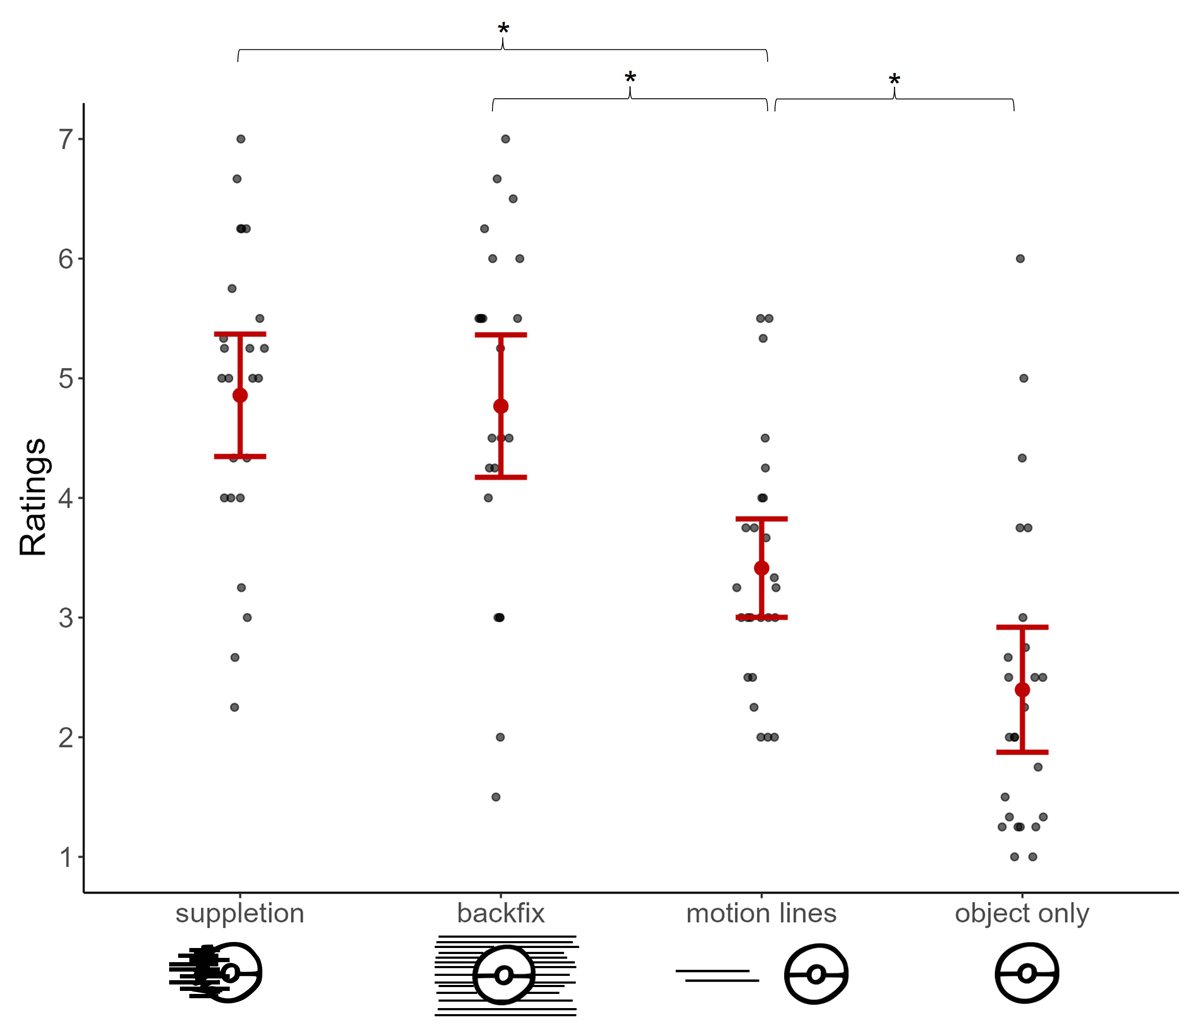
Figure 3
Subjective speed ratings (1 = extremely slow, 7 = extremely fast) averaged across each motion cue type. Each gray dot represents averaged ratings per participant while the red dot indicates the overall mean, and error bars show the standard errors. Asterisks (*) highlight the significant differences that arose between the tested contrasts.
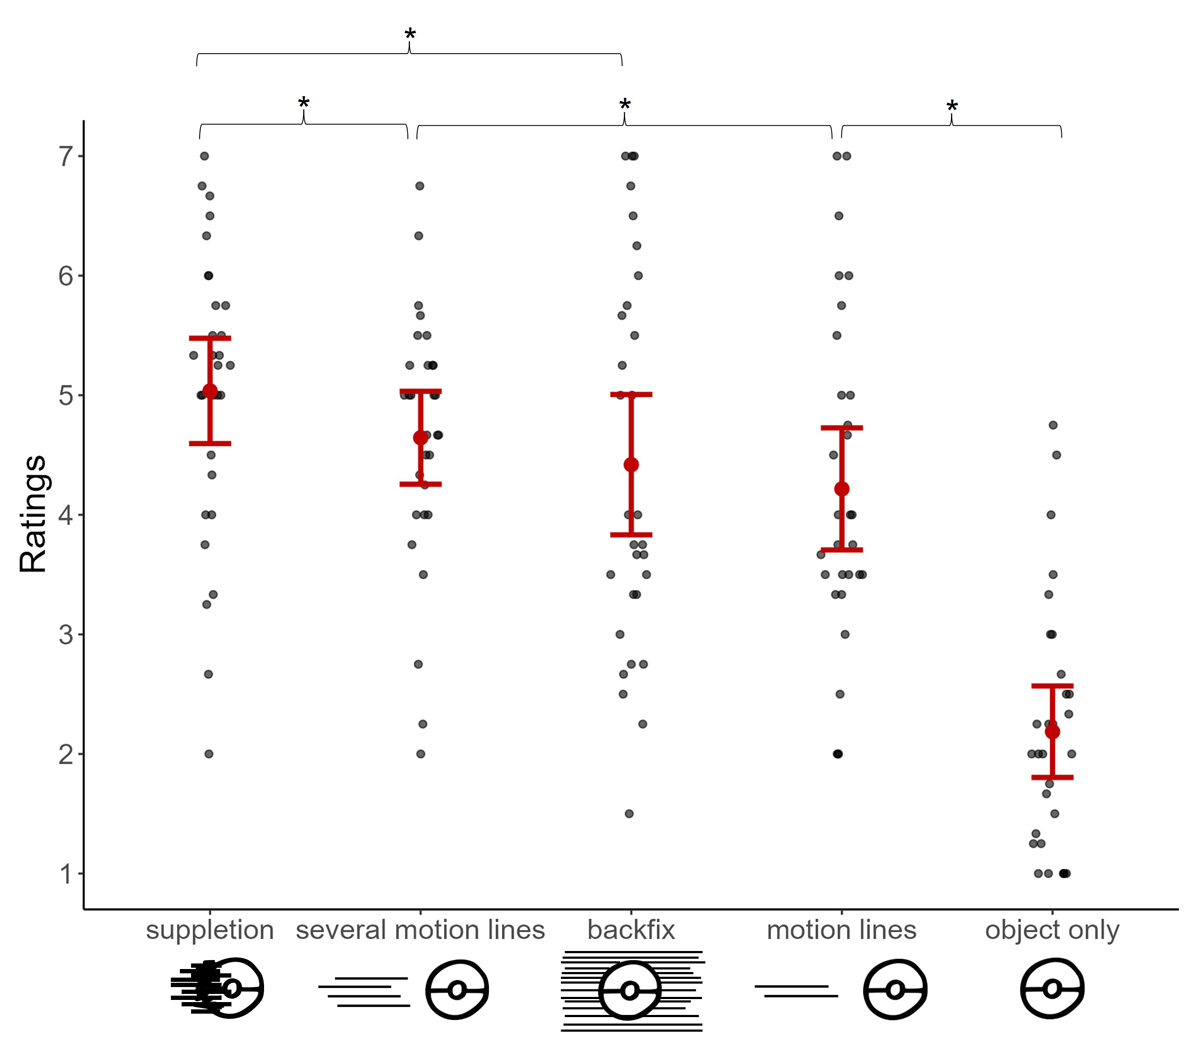
Figure 4
Subjective speed ratings (1 = extremely slow, 7 = extremely fast) given in Experiment 2 averaged across each motion cue type. Each gray dot represents averaged ratings per participant while the red dot indicates the overall mean, and error bars show the standard errors. Asterisks (*) highlight the significant differences that arose between the tested contrasts.
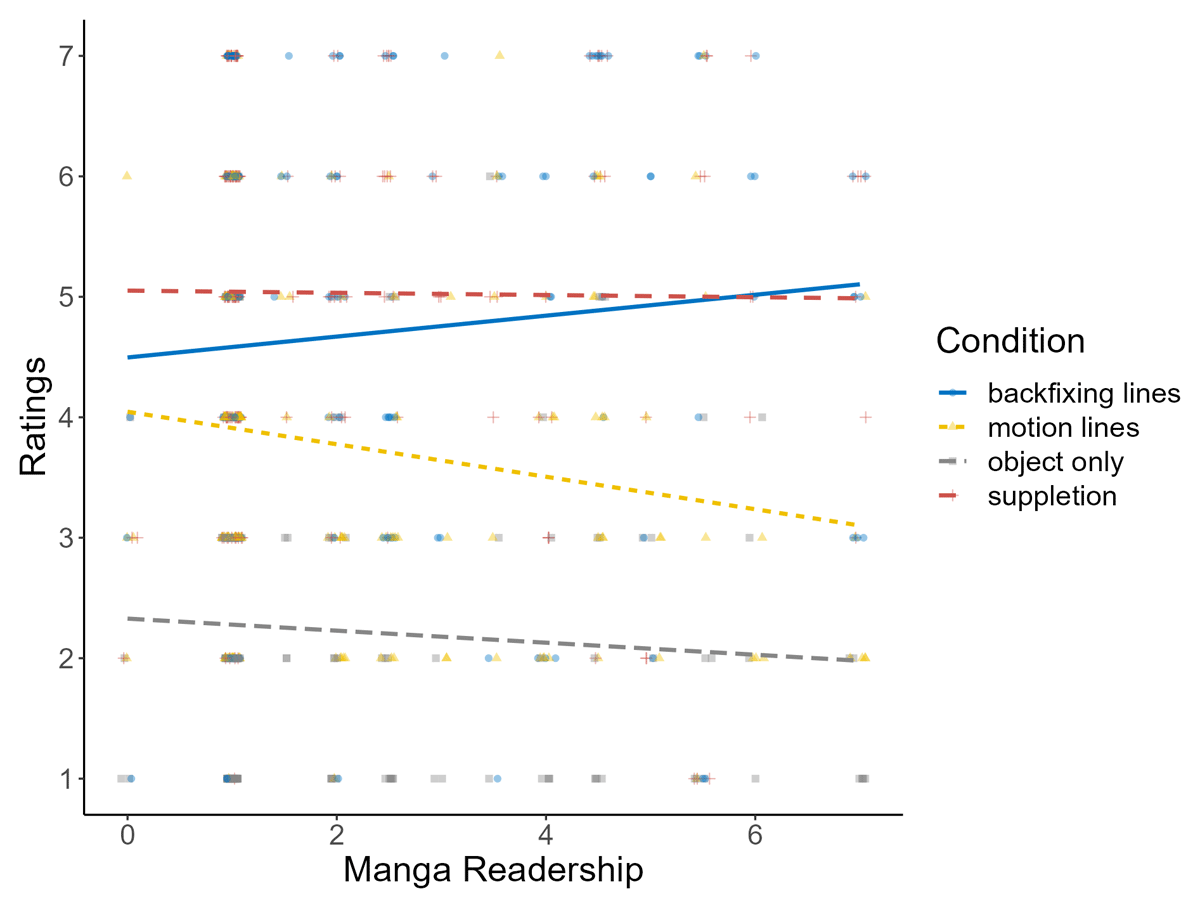
Figure 5
Y-axis shows the subjective speed ratings (1 = extremely slow, 7 = extremely fast) and x-axis shows participants’ fluency scores in reading manga (higher numbers indicate greater fluency levels) when the data from Experiments 1 and 2 were combined. Each line corresponds to a motion cue type that were present in both experiments (i.e., backfixing lines, motion lines, object only, suppletion lines). This graph shows the magnitude of the difference found between backfixing lines (blue line) and motion lines (yellow line) changes depending on participants’ experience levels in reading manga.
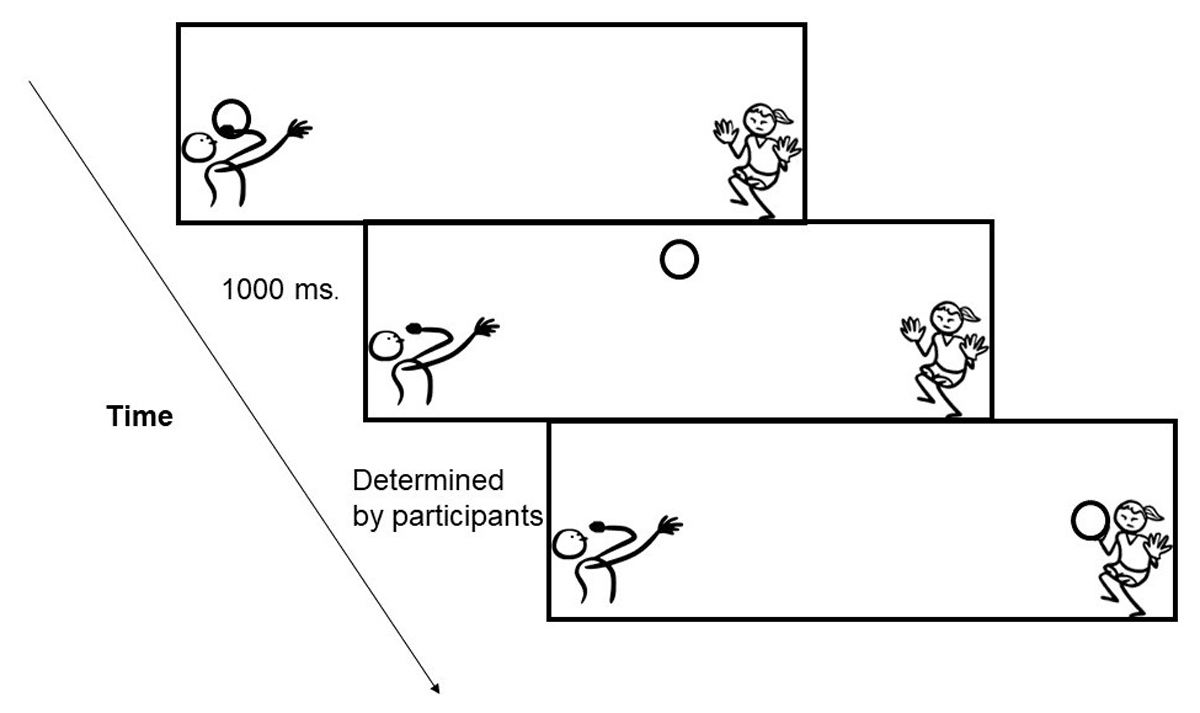
Figure 6
The design of Experiment 3. Between the first two frames showing the starting point (panel 1) and midpoint (panel 2) of the action, SOA was always constant as 1000 ms. Participants then pressed a button to indicate when the object would reach to its endpoint (panel 3), and we measured the real time estimates given for each cue between panels 2 and 3. The figure illustrates object-only condition.
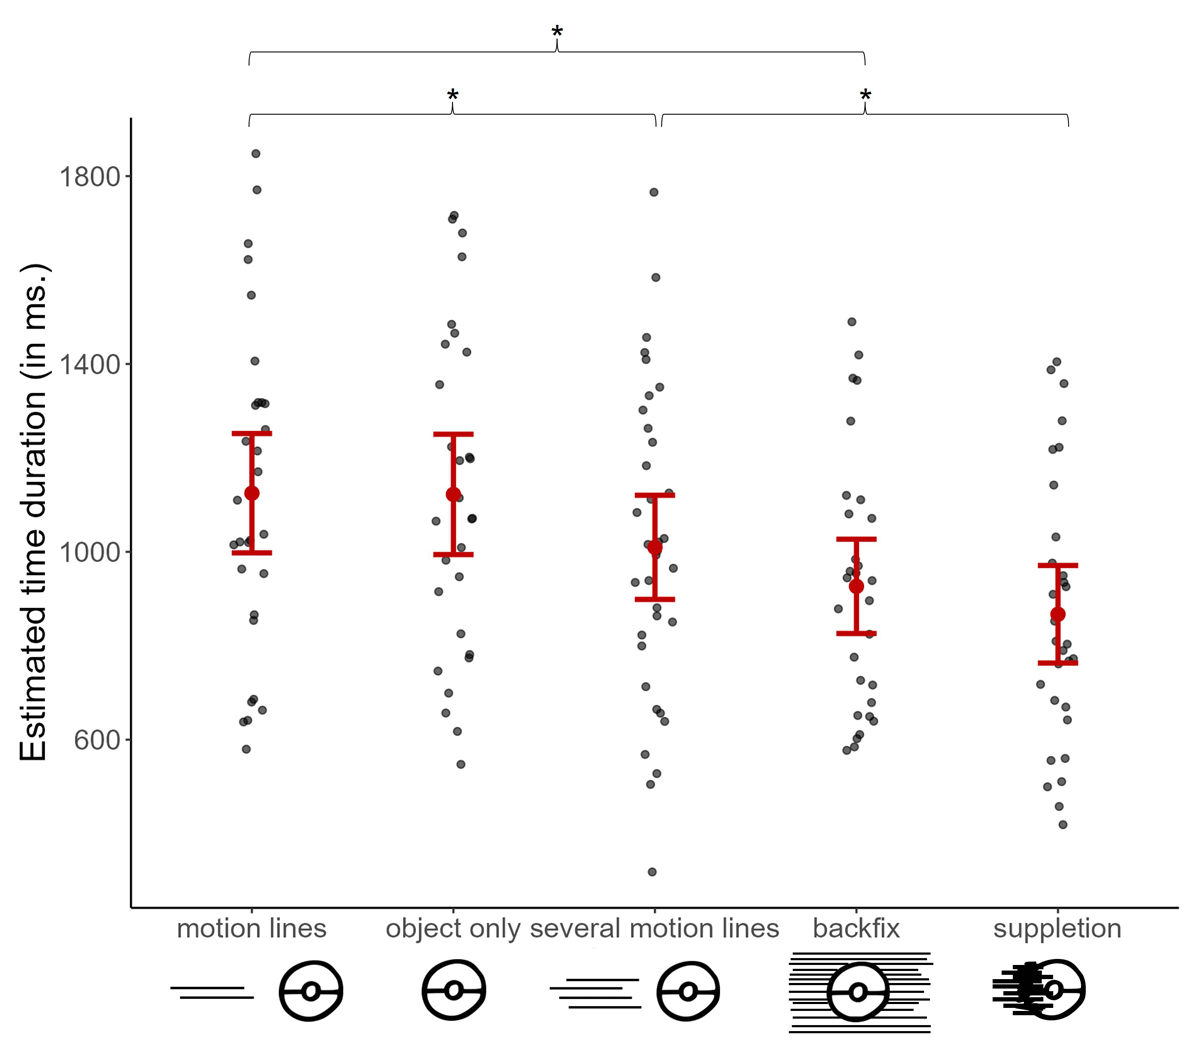
Figure 7
Estimated time durations averaged across motion cue types. Each gray dot represents each participant’s averaged time estimates per condition, while the red one showing the mean, and error bars show standard errors. Asterisks (*) highlight the significant differences that arose between the tested contrasts.