
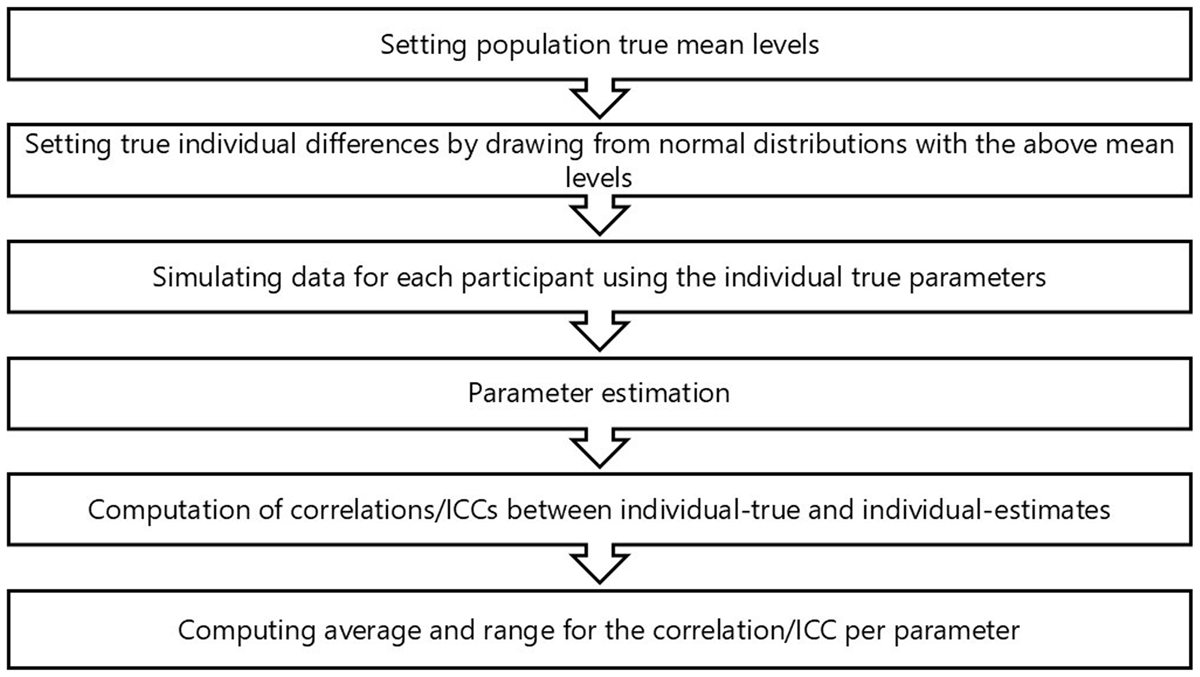
Figure 1
Summary of the steps involved in Study 1.
Table 1
Population mean value in the 21 models from Study 1. v. TRUE and v. FALSE represent the mean drift rate for the correct and incorrect response, respectively.
| STARTING POINT | BOUNDARY | V. TRUE | V. FALSE | sv |
|---|---|---|---|---|
| 2 | 2.3 | 2.3 | 0.6 | 1 |
| 2 | 2.5 | 2.3 | 0.6 | 1 |
| 2 | 2.7 | 2.3 | 0.6 | 1 |
| 2 | 2.3 | 2.5 | 0.6 | 1 |
| 2 | 2.5 | 2.5 | 0.6 | 1 |
| 2 | 2.7 | 2.5 | 0.6 | 1 |
| 2 | 2.3 | 2.7 | 0.6 | 1 |
| 2 | 2.5 | 2.7 | 0.6 | 1 |
| 2 | 2.7 | 2.7 | 0.6 | 1 |
| 2 | 2.3 | 2.3 | 0.8 | 1 |
| 2 | 2.5 | 2.3 | 0.8 | 1 |
| 2 | 2.7 | 2.3 | 0.8 | 1 |
| 2 | 2.3 | 2.5 | 0.8 | 1 |
| 2 | 2.5 | 2.5 | 0.8 | 1 |
| 2 | 2.7 | 2.5 | 0.8 | 1 |
| 2 | 2.3 | 2.7 | 0.8 | 1 |
| 2 | 2.5 | 2.7 | 0.8 | 1 |
| 2 | 2.7 | 2.7 | 0.8 | 1 |
| 2 | 2.3 | 2.3 | 1 | 1 |
| 2 | 2.5 | 2.3 | 1 | 1 |
| 2 | 2.7 | 2.3 | 1 | 1 |
Table 2
Pearson correlation and ICC2,1 range and mean for all parameters using the new method in Study 1.
| PARAMETER | METHOD | LOWER BOUND | HIGHER BOUND | MEAN VALUE |
|---|---|---|---|---|
| Starting point | Pearson cor. | 0.770 | 0.900 | 0.840 |
| Boundary | Pearson cor. | 0.614 | 0.909 | 0.827 |
| v.true | Pearson cor. | 0.867 | 0.959 | 0.911 |
| v.false | Pearson cor. | 0.274 | 0.566 | 0.439 |
| sv | Pearson cor. | 0.875 | 0.958 | 0.924 |
| Starting point | ICC2,1 | 0.660 | 0.897 | 0.818 |
| Boundary | ICC2,1 | 0.578 | 0.905 | 0.806 |
| v.true | ICC2,1 | 0.842 | 0.941 | 0.898 |
| v.false | ICC2,1 | 0.038 | 0.540 | 0.209 |
| sv | ICC2,1 | 0.861 | 0.950 | 0.917 |
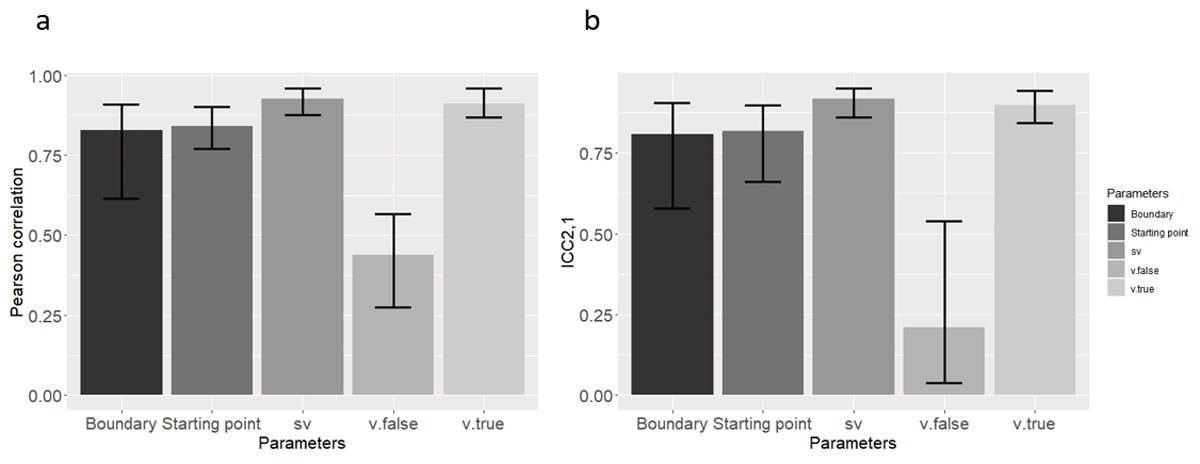
Figure 2
Mean (a) Pearson correlation, and (b) ICC2,1 Across the 21 Simulated Datasets (Means were computed through Fisher’s Z transformation), using the new method in Study 1. Error bars represent the lower and upper range of correlations from the 21 models.
Table 3
Pearson correlation and ICC2,1 range and mean for all parameters using the classic method in Study 1.
| PARAMETER | METHOD | LOWER BOUND | HIGER BOUND | MEAN VALUE |
|---|---|---|---|---|
| Starting point | Pearson cor. | 0.780 | 0.920 | 0.881 |
| Boundary | Pearson cor. | 0.966 | 0.992 | 0.987 |
| v.true | Pearson cor. | 0.988 | 0.993 | 0.991 |
| v.false | Pearson cor. | 0.424 | 0.957 | 0.615 |
| Starting point | ICC2,1 | 0.756 | 0.917 | 0.869 |
| Boundary | ICC2,1 | .960 | 0.992 | 0.984 |
| v.true | ICC2,1 | 0.988 | 0.993 | 0.991 |
| v.false | ICC2,1 | 0.0431 | 0.956 | 0.434 |
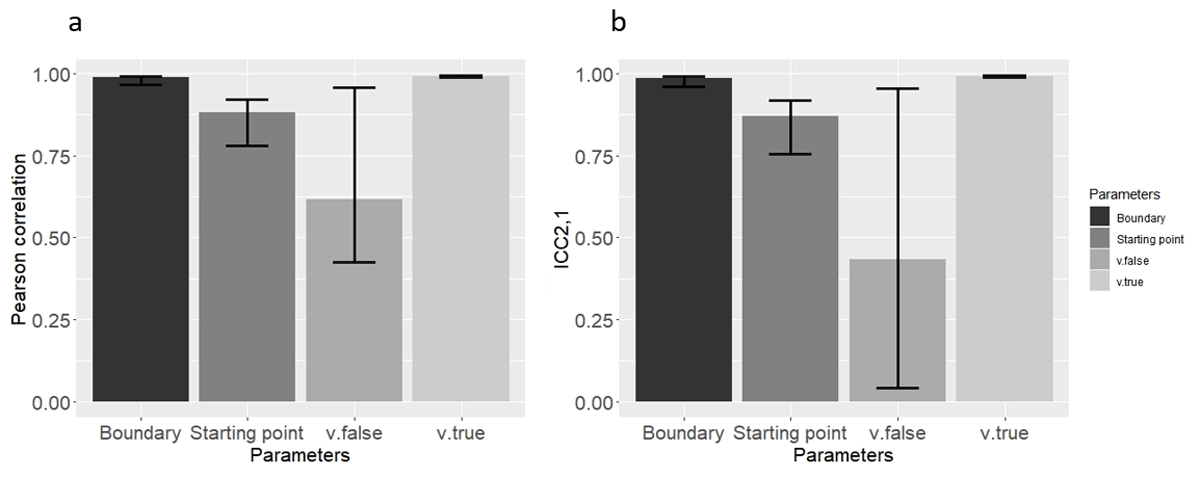
Figure 3
Mean (a) Pearson correlation, and (b) ICC2,1 Across the 21 Simulated Datasets (Means were computed through Fisher’s Z transformation), using the classic method in Study 1. Error bars represent the lower and upper range of correlations from the 21 models.
Table 4
Pearson correlations and ICC2,1 range and value for all parameters using the new method in Study 2.
| PARAMETER | METHOD | LOWER BOUND | HIGHER BOUND | VALUE |
|---|---|---|---|---|
| Starting point | Pearson cor. | 0.719 | 0.864 | 0.803 |
| Boundary | Pearson cor. | 0.658 | 0.831 | 0.758 |
| v.true | Pearson cor. | 0.739 | 0.874 | 0.818 |
| v.false | Pearson cor. | 0.857 | 0.933 | 0.902 |
| sv | Pearson cor. | 0.923 | 0.965 | 0.948 |
| Starting point | ICC2,1 | –0.092 | 0.800 | 0.490 |
| Boundary | ICC2,1 | –0.094 | 0.750 | 0.420 |
| v.true | ICC2,1 | –0.084 | 0.790 | 0.470 |
| v.false | ICC2,1 | 0.510 | 0.920 | 0.830 |
| sv | ICC2,1 | 0.048 | 0.920 | 0.770 |
Table 5
Pearson correlation and ICC2,1 range and value for all parameters using the classic method in Study 2.
| PARAMETER | METHOD | LOWER BOUND | HIGHER BOUND | MEAN VALUE |
|---|---|---|---|---|
| Starting point | Pearson cor. | 0.255 | 0.579 | 0.431 |
| Boundary | Pearson cor. | 0.297 | 0.609 | 0.467 |
| v.true | Pearson cor. | 0.186 | 0.529 | 0.370 |
| v.false | Pearson cor. | 0.680 | 0.842 | 0.774 |
| Starting point | ICC2,1 | 0.081 | 0.44 | 0.270 |
| Boundary | ICC2,1 | 0.14 | 0.49 | 0.32 |
| v.true | ICC2,1 | 0.033 | 0.39 | 0.22 |
| v.false | ICC2,1 | 0.60 | 0.80 | 0.71 |
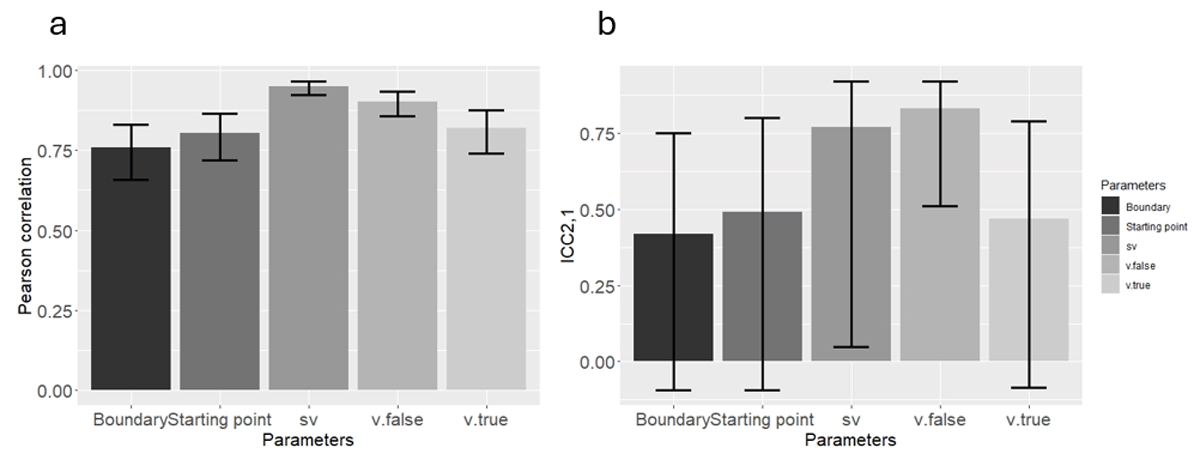
Figure 4
(a) Pearson correlation, and (b) ICC2,1, using the new method in Study 2. Error bars represent 95 percent confidence interval.
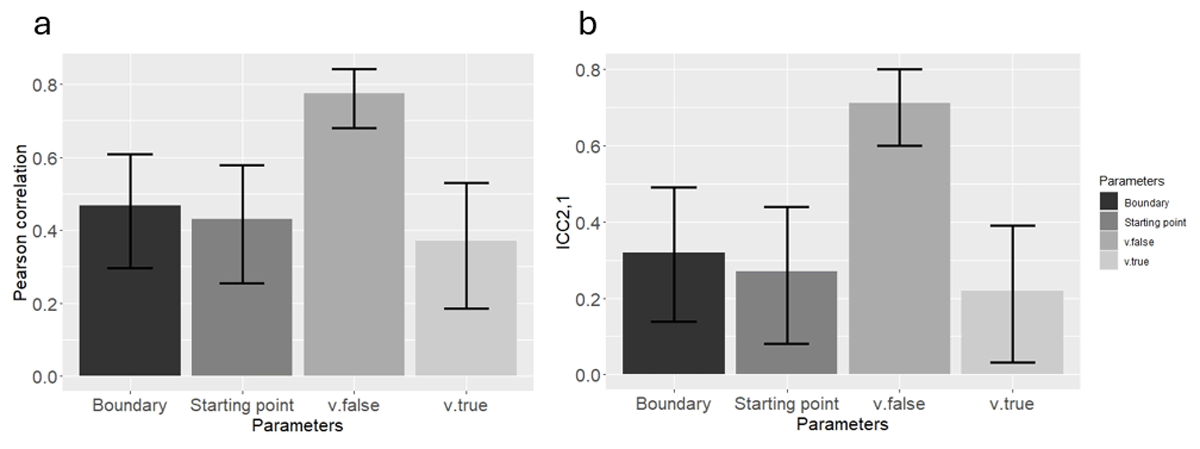
Figure 5
(a) Pearson correlation, and (b) ICC2,1, using the classical method in Study 2. Error bars represent 95 percent confidence interval.