
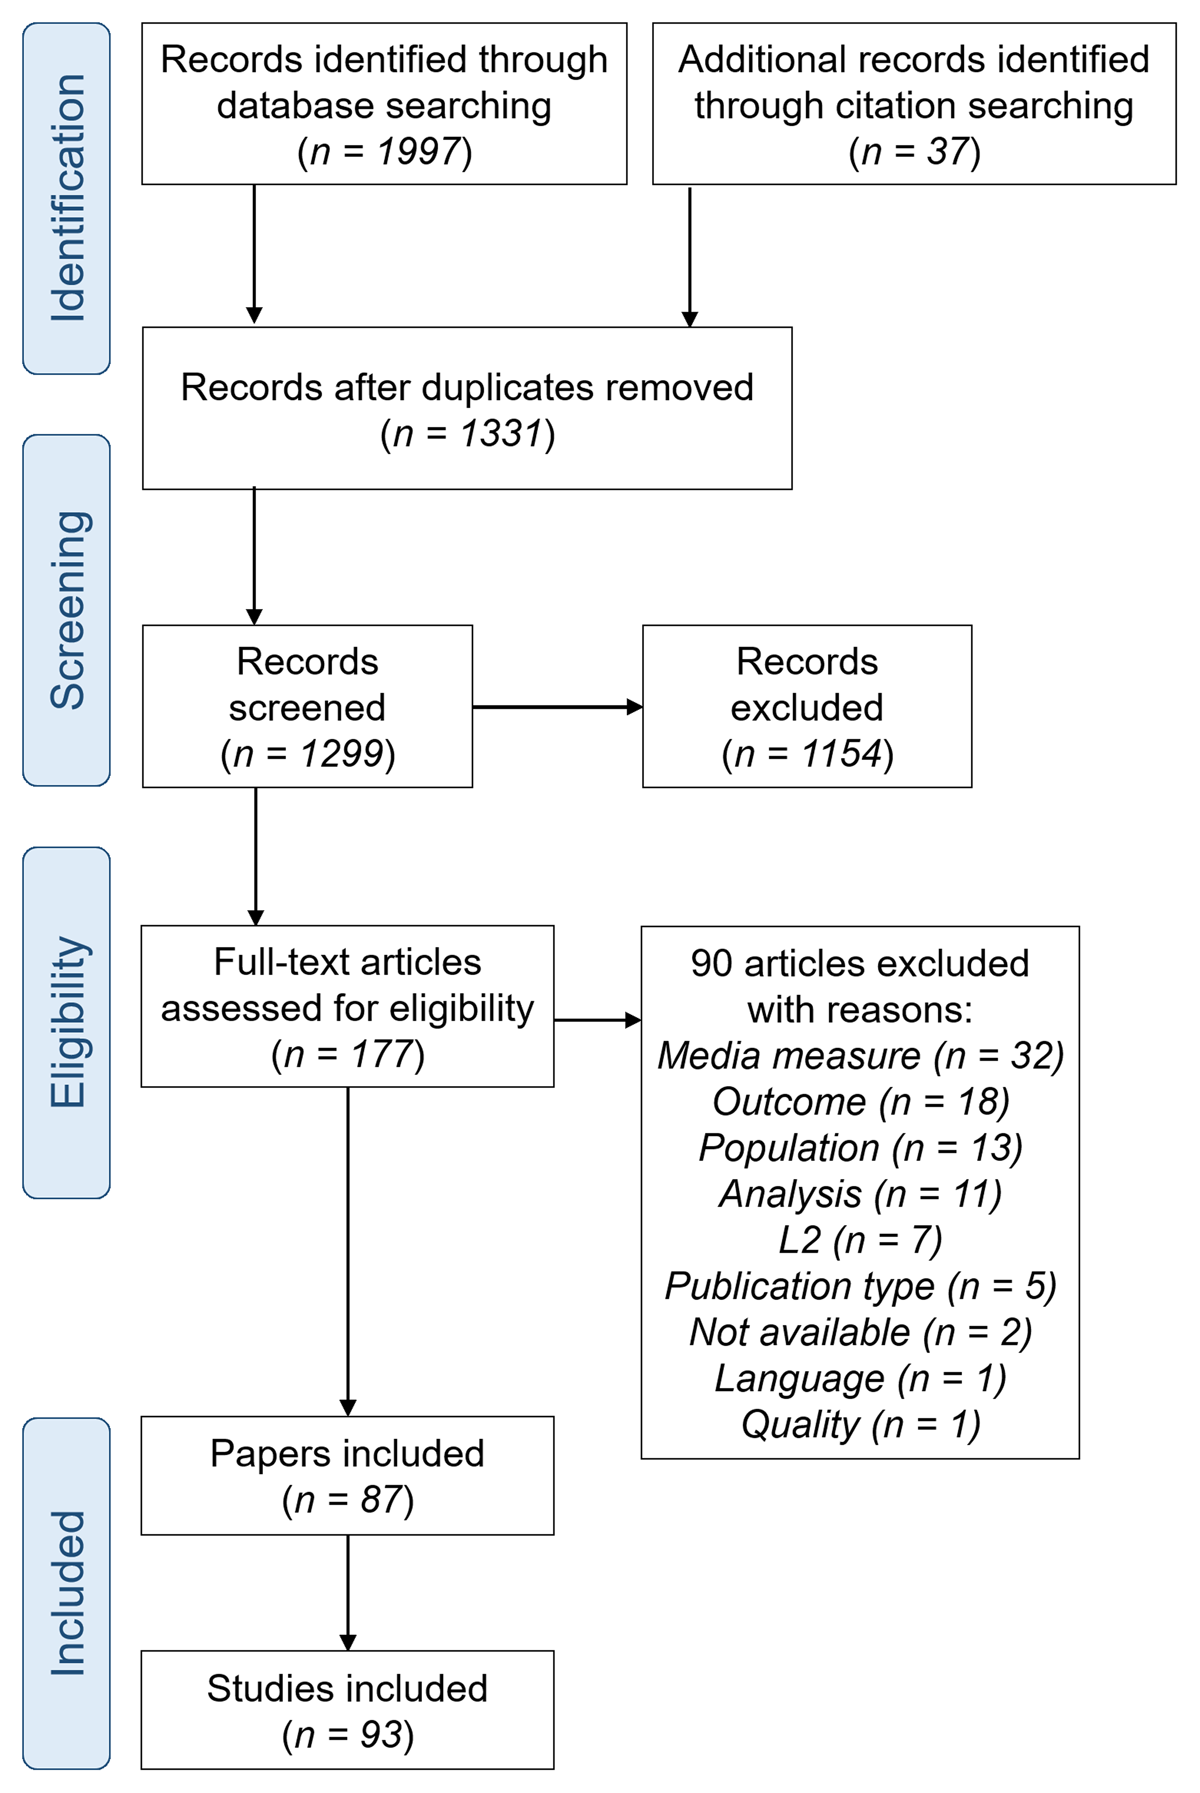
Figure 1
PRISMA flow diagram.
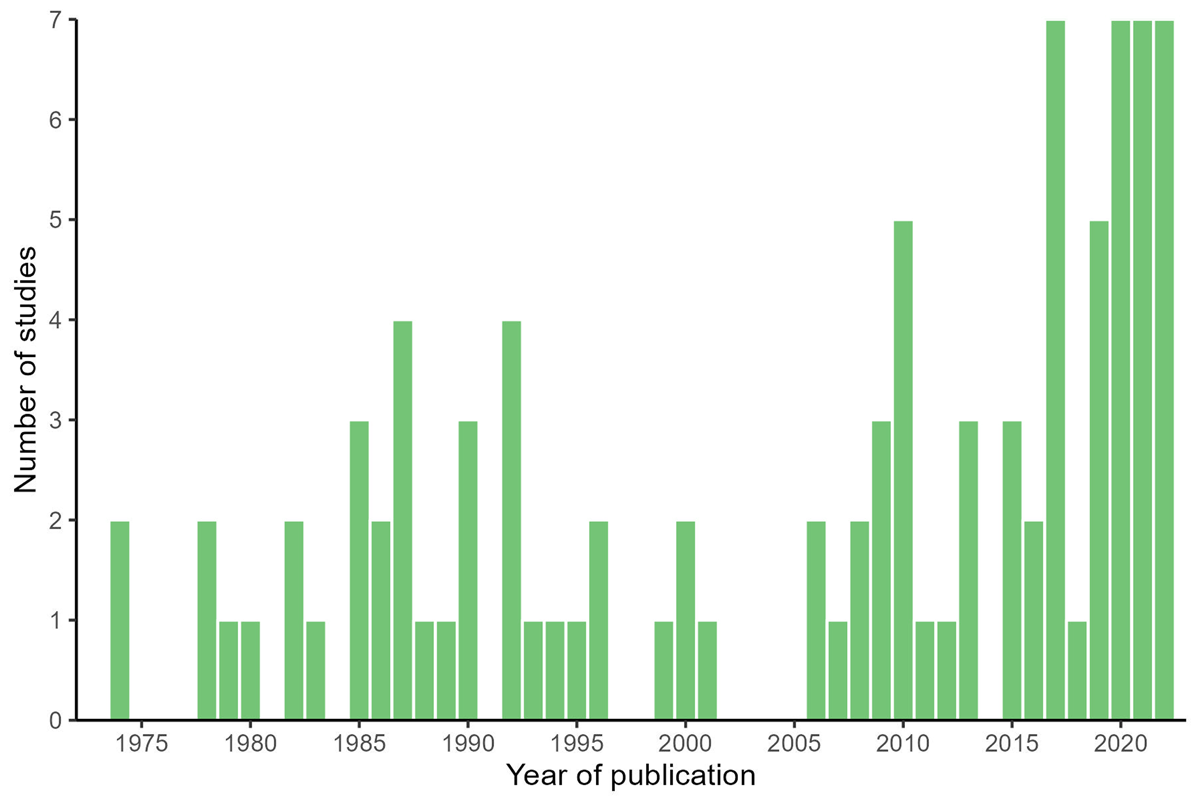
Figure 2
Publication year for all 87 papers included in the review.
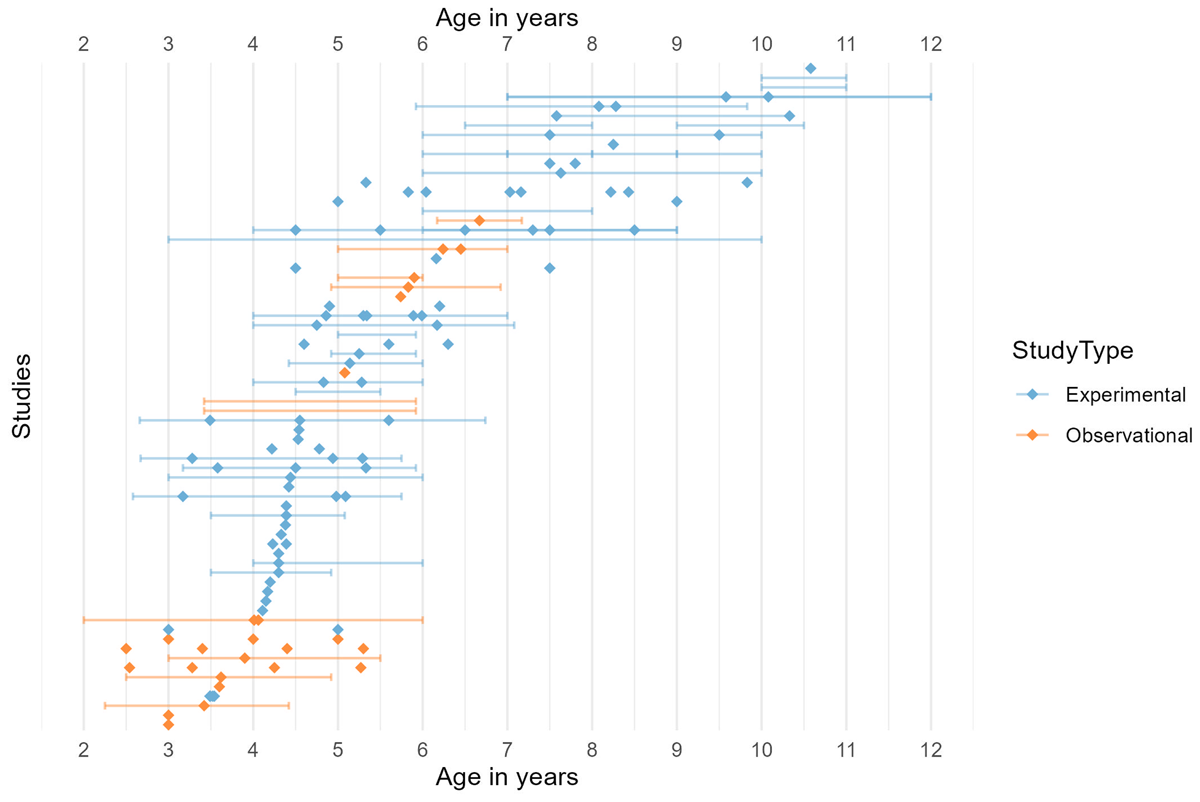
Figure 3
Age data (means and ranges) from single-timepoint studies. Each diamond refers to the mean age of a group of participants in a particular study. Lines show the age range of each group (where reported). Colour refers to study design: blue for experimental studies and orange for observational studies. Note that where a study has reported age data for two groups separately, the means for each group are plotted separately on the same row.
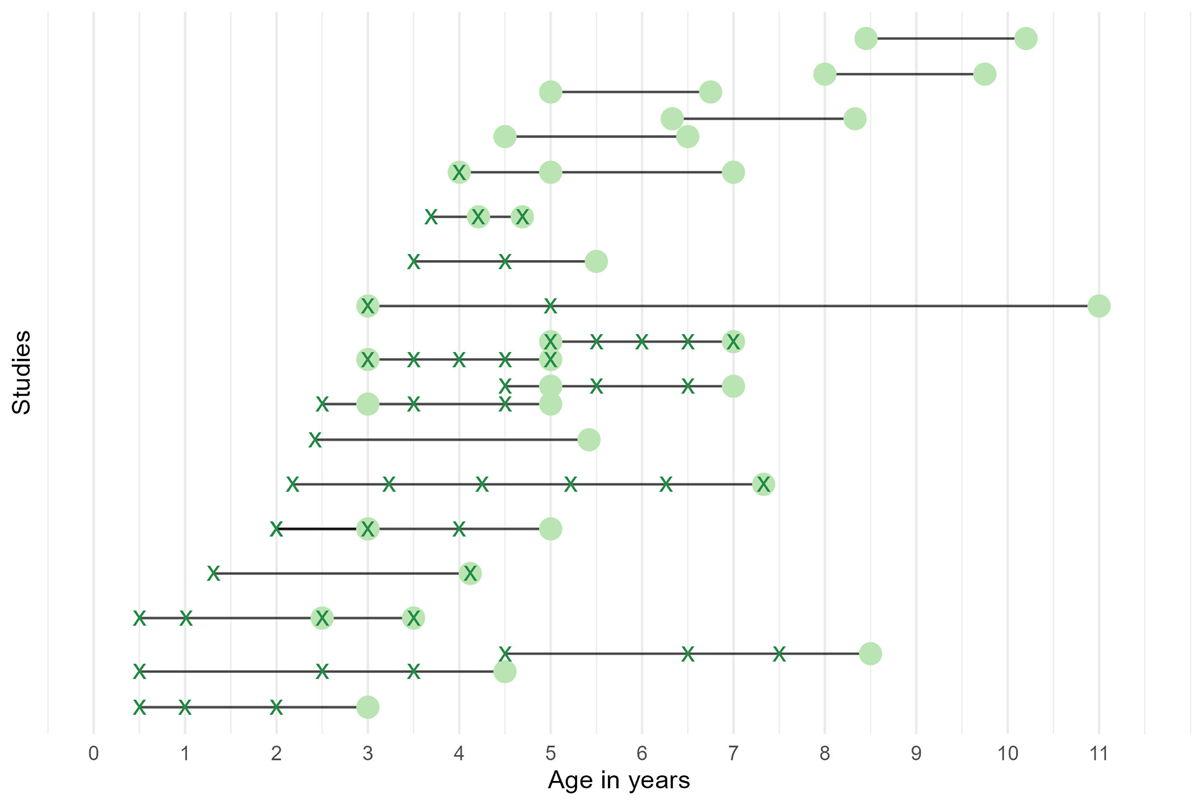
Figure 4
Participant ages during different waves of longitudinal studies. In this graph, each row represents a single longitudinal study and black lines represent the ages covered by the study from start to finish. Where a study contains two cohorts, these are represented separately as offset lines. Each green cross represents the age at which screen time data were collected, while each green dot represents the age at which language data were collected.
Table 1
Categories of outcome measures.
| LANGUAGE LEVEL | CATEGORY DEFINITION | EXAMPLE TASKS GENERALISED | TARGETED |
|---|---|---|---|
| Conceptual knowledge | Tests of underlying conceptual knowledge (not necessarily linked to a particular linguistic form) | Tests of conceptual content of children’s language (unrelated to recently encountered video content). Example: Measuring the amount of semantic information present within an utterance [42]. | Tests of concepts recently encountered in video. Example: Asking children to point to a picture of a concept underlying a word without linking it to the wordform (e.g. ‘point at the picture that ‘tells musicians what to do’ for the concept of ‘conductor’) [12]. |
| Vocabulary | Tests of knowledge of, or familiarity with, individual word forms or meanings. | Tests to assess overall vocabulary level. Example: Standardised vocabulary tests such as the Peabody Picture Vocabulary Test (PPVT) [32]. | Tests of words recently encountered in video. Example: Asking children to point at pictures representing the meanings of words they have just encountered [2]. |
| Syntax or morphology | Tests of syntactic or morphological knowledge that focus on linguistic structure rather than meaning. | Example: Counting the number of different syntactic forms produced [42] Example: Test of Dutch plural formation [34]. | N/A |
| Narrative | Measures related to children’s understanding or recall of longer linguistic units such as narratives. Includes assessments of basic narrative recall as well as higher level understanding (i.e. inferred or implied information). | Tests of knowledge of story structure or inferencing ability (unrelated to recently encountered video content) Example: Asking children to arrange a set of pictures and then tell a story based on the pictures [10]. | Tests of recall or inferencing based on a recently encountered video Example: Free recall of story events in a short video clip [68]. Example: Arranging pictures to the plot of a video clip [36]. |
| General | Tests that span a number of linguistic levels to provide a composite score that reflects a child’s overall level of ‘language ability’. | Example: Standardised tests of language level such as the Test of Early Language Development (TELD) [20]. | N/A |
[i] Note: Numbers in square brackets indicate the ID number of a paper that uses the example measure. These can be matched to papers by finding the PaperID column in the extracted data on OSF. Cells are marked as N/A where there were no outcome measures in that category.
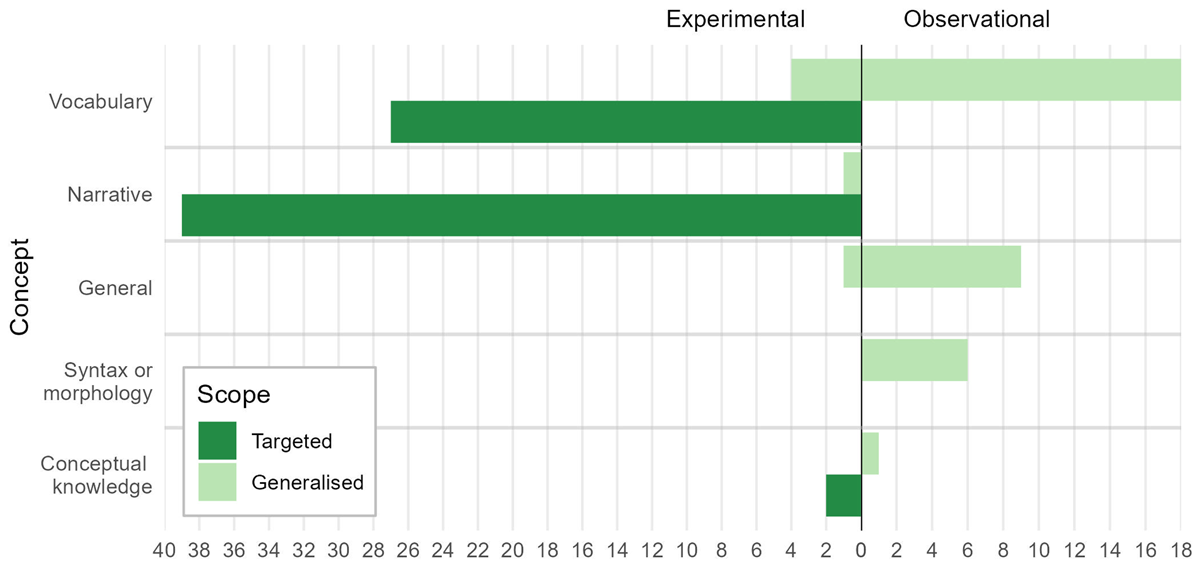
Figure 5
Outcome measures for all studies. This figure shows the number of studies that measured a particular language skill (i.e. Vocabulary) of a particular type (targeted vs generalised). Outcomes used by experimental studies are on the left, observational studies are on the right. Note that each study can contribute only once to each count, so an observational study that reported two generalised vocabulary measures (for example) would only be counted once in this category.
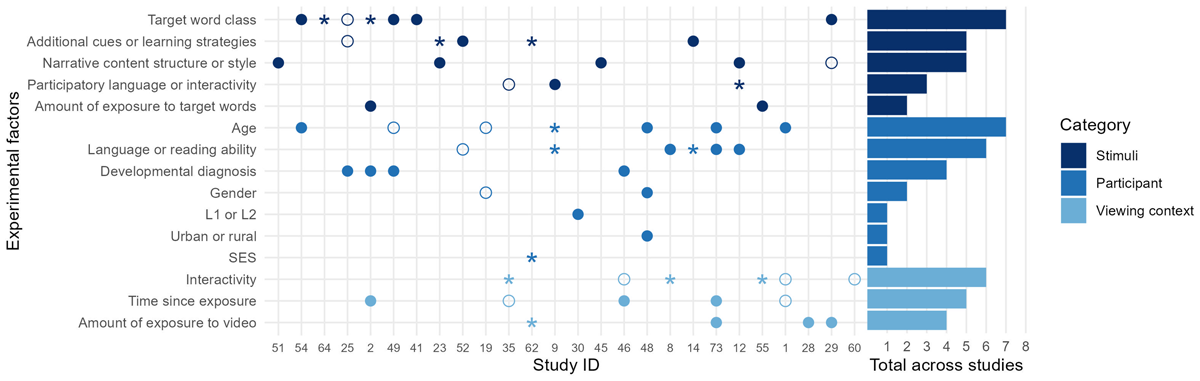
Figure 6
Effects of experimental factors on vocabulary outcomes. Each point on the x-axis represents a separate study, organized by year of publication (see the StudyID column in the extracted data on OSF to match these numbers to particular studies) and each point on the y-axis indicates a different type of experimental factor. Factors are split into three categories (factors relating to the participant, stimuli, or viewing context). The bar chart on the right indicates the total number of experimental studies that examined a particular factor. Filled circles represent a significant main effect of that factor on at least one vocabulary outcome within a study, asterisks represent a significant interaction or simple effect on at least one vocabulary outcome in the absence of a significant main effect, and empty circles represent no significant effects on any vocabulary outcomes within a study.
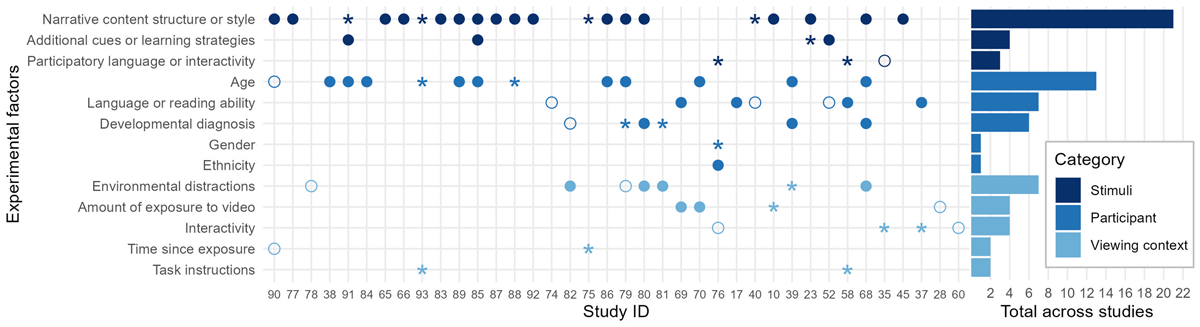
Figure 7
Effects of experimental factors on narrative outcomes. Each point on the x-axis represents a separate study, organized by year of publication (see the StudyID column in the extracted data on OSF to match these numbers to particular studies) and each point on the y-axis indicates a different type of experimental factor. Factors are split into three categories (factors relating to the participant, stimuli, or viewing context). The bar chart on the right indicates the total number of experimental studies that examined a particular factor. Filled circles represent a significant main effect of that factor on at least one narrative outcome within a study, asterisks represent a significant interaction or simple effect on at least one narrative outcome in the absence of a significant main effect, and empty circles represent no significant effects on any narrative outcomes within a study.
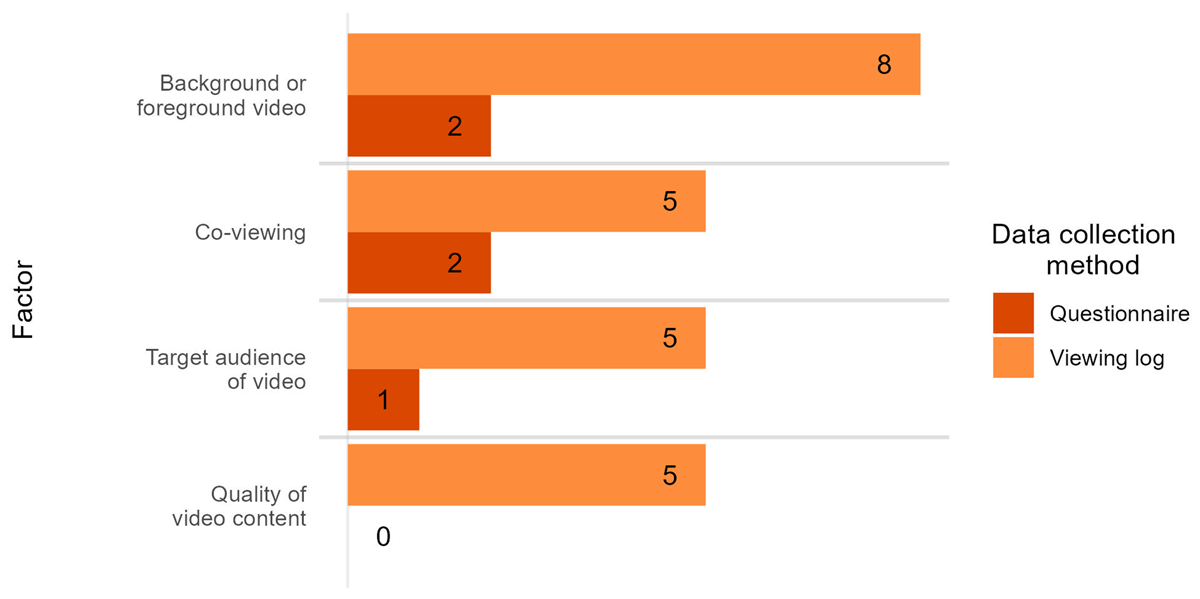
Figure 8
Additional information collected along with viewing data (observational studies only). The y-axis represents the categories of additional information that was measured by different studies, split by type of measurement tool used (questionnaire or viewing log). The x-axis indicates the number of separate studies that measured each factor.
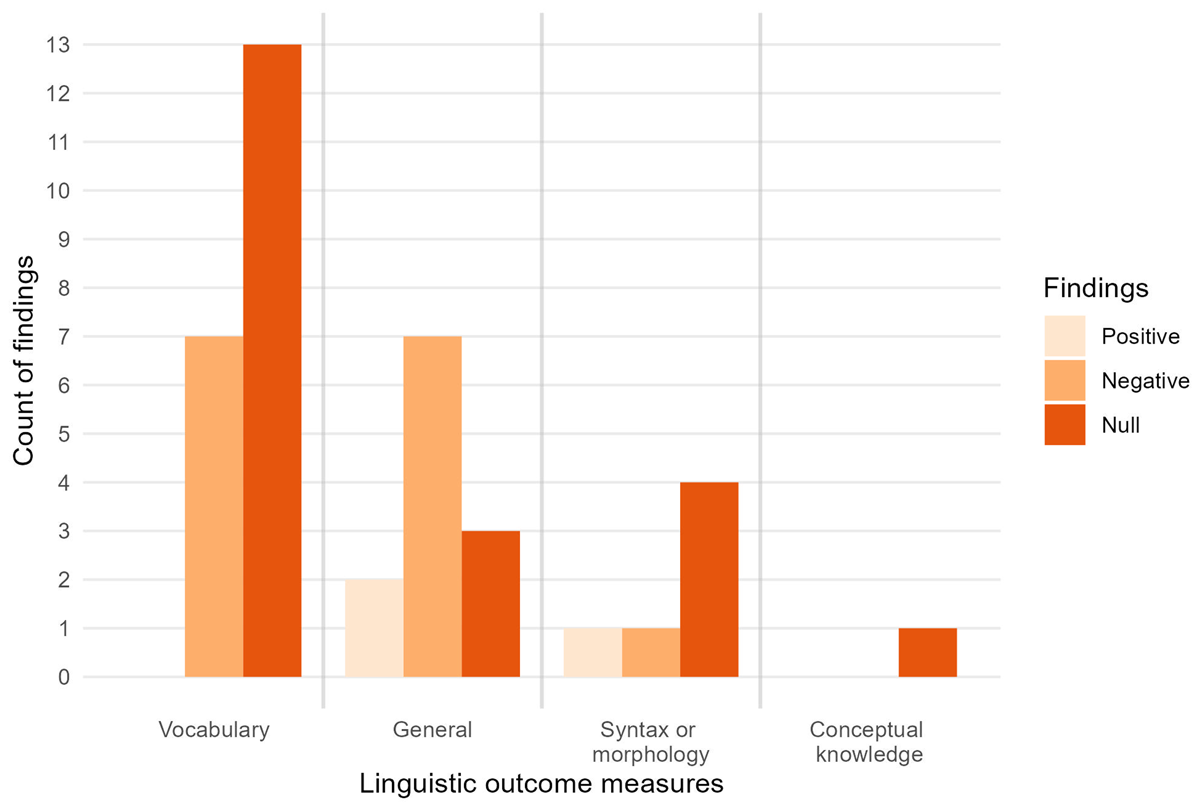
Figure 9
Associations between measures of total video exposure and linguistic outcomes (observational studies only). Different linguistic concepts are represented along the x-axis and the different colours represent different types of association.
| LINE | SEARCH TERM | TOTAL RESULTS |
|---|---|---|
| 1 | “language outcome*” | 971 |
| 2 | vocabulary | 43108 |
| 3 | “word learning” | 3305 |
| 4 | syntax | 12118 |
| 5 | “sentence comprehension” | 5082 |
| 6 | “language learning” | 18001 |
| 7 | “language acquisition” | 10118 |
| 8 | “language development” | 38562 |
| 9 | “linguistic development” | 737 |
| 10 | 1 or 2 or 3 or 4 or 5 or 6 or 7 or 8 or 9 | 103103 |
| 11 | “screen media” | 267 |
| 12 | “video media” | 64 |
| 13 | Television | 21302 |
| 14 | “screen use” | 183 |
| 15 | “media us*” | 6165 |
| 16 | “media exposure” | 3040 |
| 17 | TV | 11314 |
| 18 | 11 or 13 or 13 or 14 or 15 or 16 or 17 | 33228 |
| 19 | child* | 889668 |
| 20 | “primary school” | 13473 |
| 21 | “primary education” | 2196 |
| 22 | preschool* | 115457 |
| 23 | kindergarten* | 22362 |
| 24 | toddler* | 12978 |
| 25 | nurser* | 5472 |
| 26 | “elementary school*” | 75133 |
| 27 | 19 or 20 or 21 or 22 or 23 or 24 or 25 | 938596 |
| 28 | 10 and 18 and 26 | 312 |
| LINE | SEARCH TERM | TOTAL RESULTS |
|---|---|---|
| 1 | “language outcome*” | 1078 |
| 2 | vocabulary | 23374 |
| 3 | “word learning” | 1953 |
| 4 | syntax | 6006 |
| 5 | “sentence comprehension” | 1448 |
| 6 | “language learning” | 2365 |
| 7 | “language acquisition” | 3030 |
| 8 | “language development” | 21303 |
| 9 | “linguistic development” | 274 |
| 10 | 1 or 2 or 3 or 4 or 5 or 6 or 7 or 8 or 9 | 51326 |
| 11 | “screen media” | 238 |
| 12 | “video media” | 39 |
| 13 | Television | 22879 |
| 14 | “screen use” | 386 |
| 15 | “media us*” | 8649 |
| 16 | “media exposure” | 1491 |
| 17 | TV | 16483 |
| 18 | 11 or 12 or 13 or 14 or 15 or 16 or 17 | 45442 |
| 19 | child* | 2722374 |
| 20 | “primary school” | 11354 |
| 21 | “primary education” | 2616 |
| 22 | preschool* | 993094 |
| 23 | kindergarten* | 8054 |
| 24 | toddler* | 14122 |
| 25 | “elementary school*” | 11912 |
| 26 | 19 or 20 or 21 or 22 or 23 or 24 or 25 | 2730428 |
| 27 | 10 and 18 and 26 | 159 |