
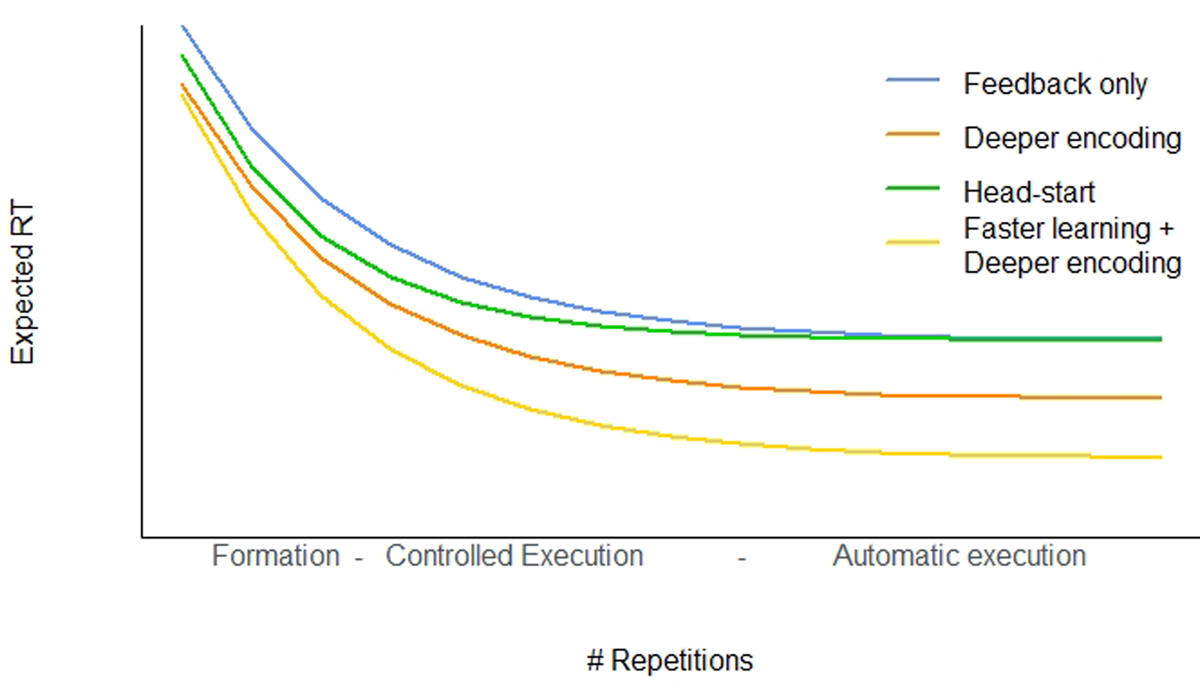
Figure 1
Different ways in which instructions could speed up responses in a stimulus-response mapping task. The blue curve represents baseline behavior; The orange, green, and yellow curves represent the predictions of different theoretical proposals (see text for details).
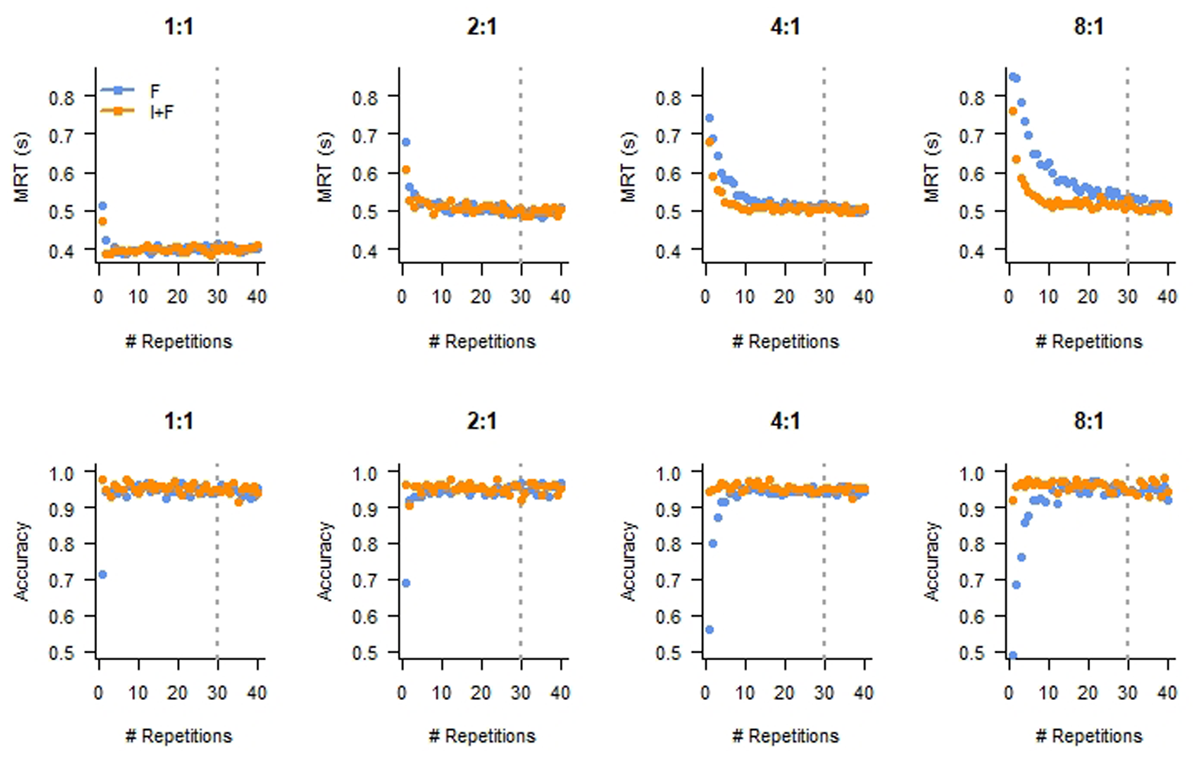
Figure 2
Mean response time (MRT, top row) and Accuracy (bottom row) as a function of Repetition reveal the expected performance improvement. Panels depict different Mapping conditions. F: Feedback only; I+F: Instruction and Feedback. The dashed lines indicate the repetition number after which we considered the data as showing asymptotic behavior.
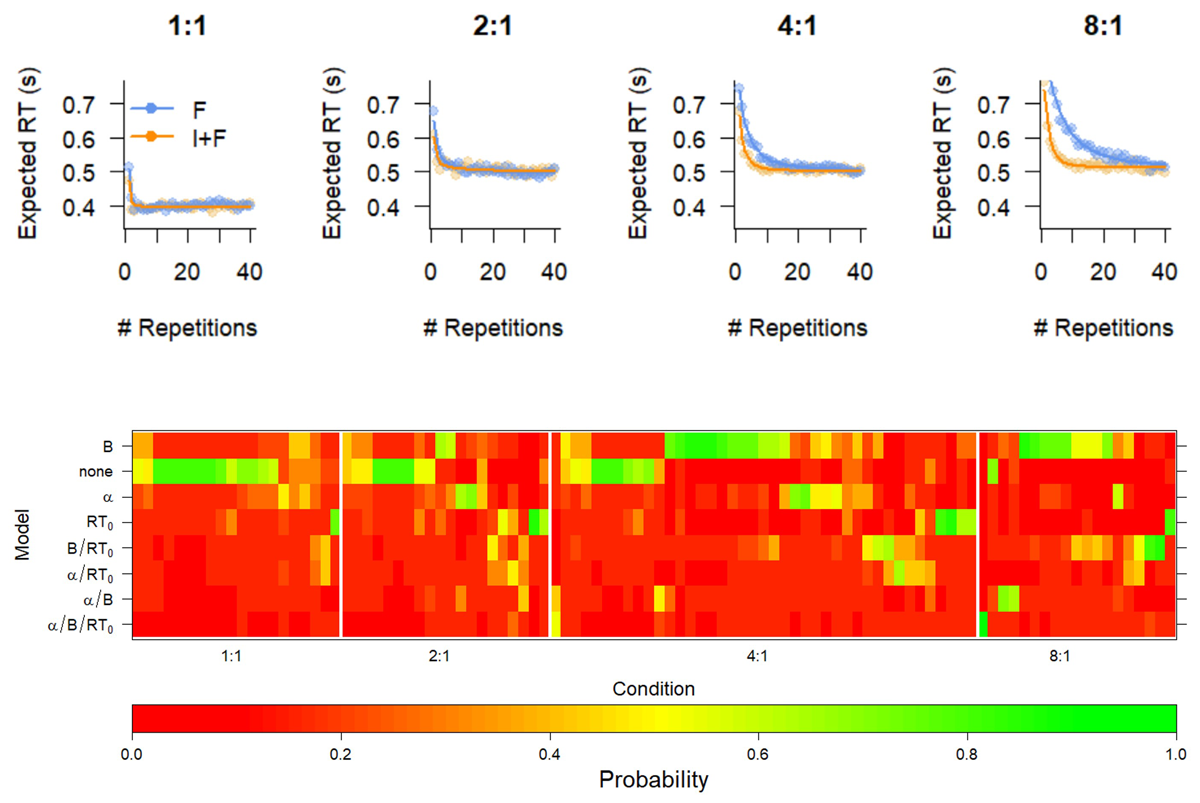
Figure 3
Fit of optimal model (top) and Model comparison (bottom) of various constraints on the exponential curve reveal that instructions boost the initial level of performance. Top. Mean response times (RT, points) and Expected RT (solid lines) of the B model. I+F: Instruction and feedback; F: feedback only. Bottom. BIC weights of all models for all participants. The models are indicated by which parameter was free to vary between F and I+F conditions. Participants are grouped according to a hierarchical clustering algorithm within the Mapping condition, for illustrative purposes. The colors represent the BIC weight.
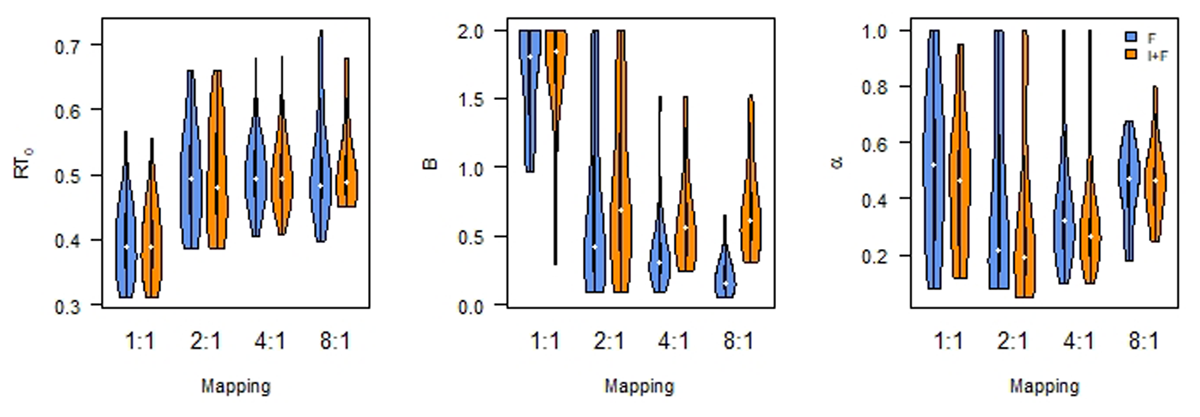
Figure 4
Asymptotic performance (RT0) differs by Mapping; Initial performance (B) differs by Instruction as well as Mapping. Learning rate (α) is not affected. F: Feedback only; I+F instruction and Feedback.
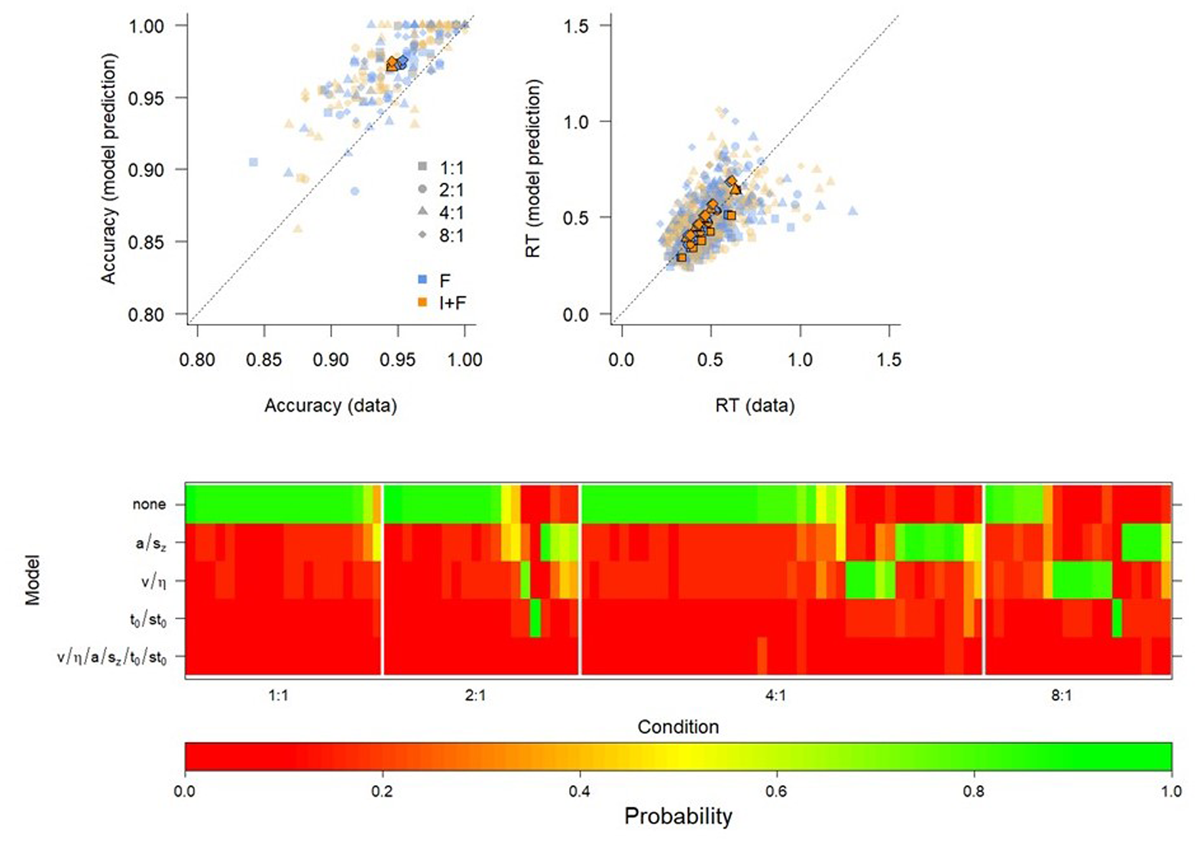
Figure 5
Fit of optimal model (Top panel) and model comparison (Bottom panel) of various constraints on the Diffusion Decision Model reveal that there are no lasting effects of instruction. Top. QQ-plots of model fits of the none model. Individual data points refer to individuals, thick shapes indicate the mean of the 0.1, 0.3, 0.5, 0.7, and 0.9 quantile RTs (cf. Miletić & Van Maanen, 2019). I+F: Instruction and feedback; F: feedback only. Bottom. BIC weights of all models for all participants. The models are indicated by which parameter was free to vary between F and I+F conditions. Participants are grouped according to a hierarchical clustering algorithm within the Mapping condition, for illustrative purposes. The colors represent the BIC weight.
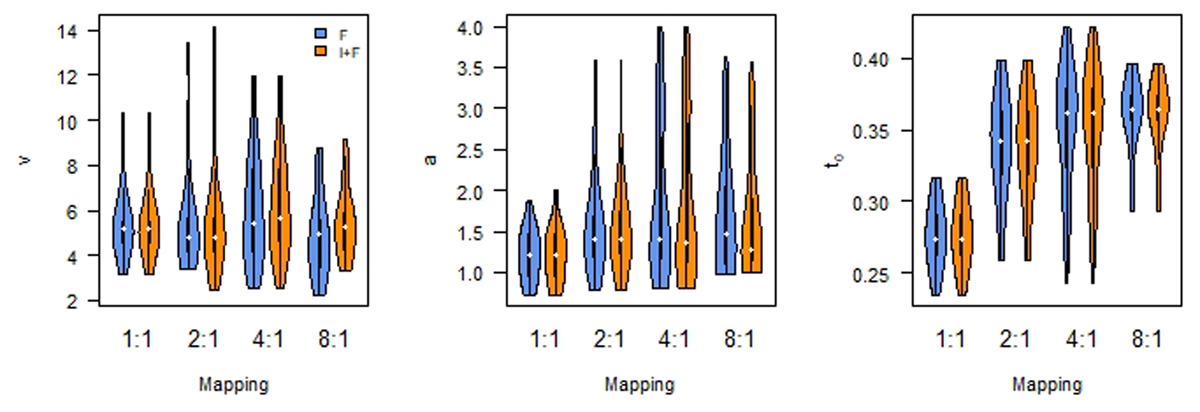
Figure 6
Diffusion Decision Model parameters by mapping. Left: drift rate; Middle: boundary separation; Right: non-decision time. F: Feedback only; I+F instruction and Feedback.
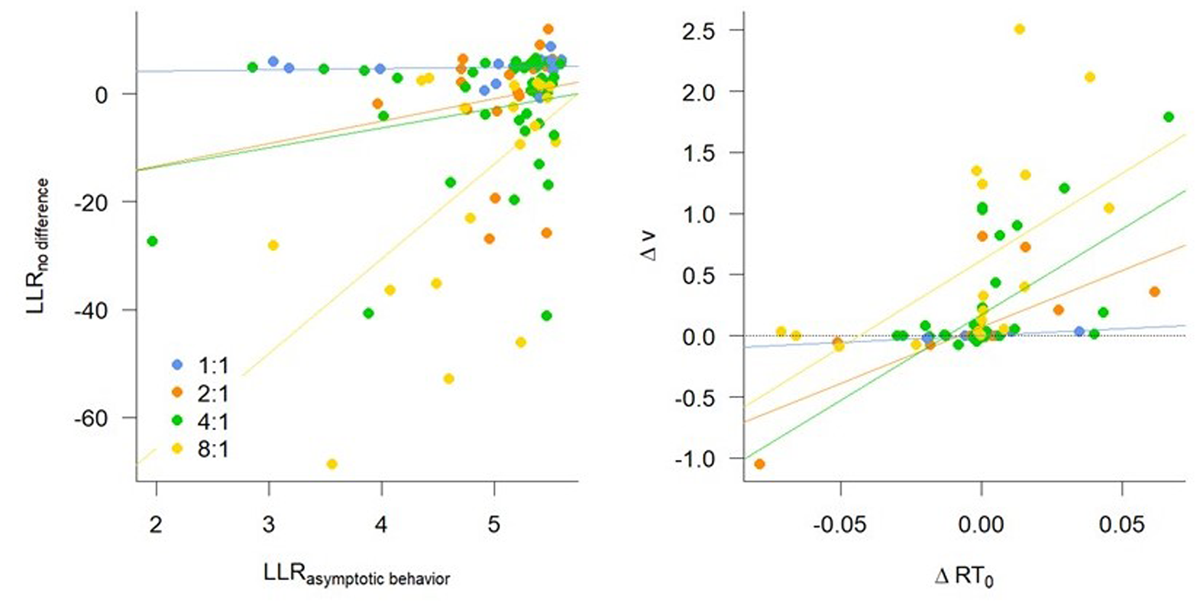
Figure 7
Participants that have not reached asymptotic behavior are best characterized by differences in drift rate and boundary separation. Left: A higher log likelihood ratio (LLR) in favor of reaching asymptotic behavior predicts a higher evidence ratio in favor of no difference between Diffusion Decision Model (DDM) parameters for the last 10 repetitions. Right: A difference in asymptotic RT (RT0) predicts a positive difference in drift rate (v).
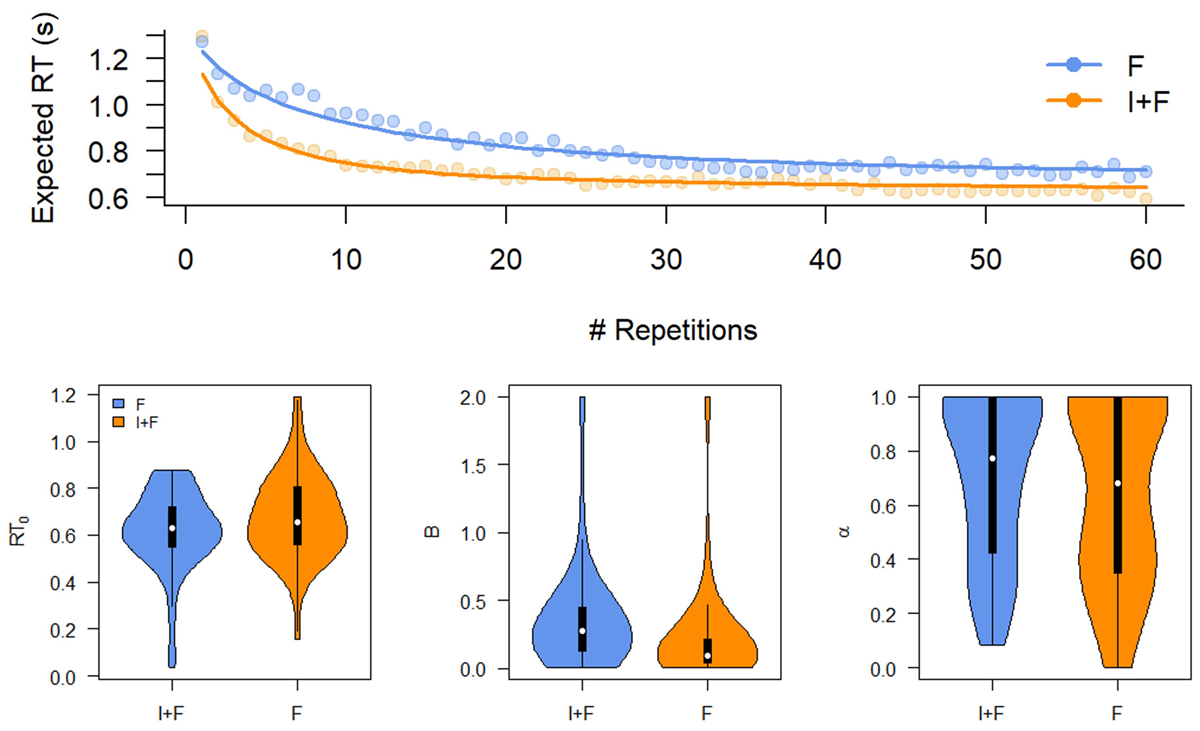
Figure 8
Model fits and parameter estimates for an exponential learning curve fit to the data of Experiment 2. Top. Mean response times (RT, points) and Expected RT (solid lines). Bottom. Asymptotic performance (RT0), initial performance (B), and learning rate (α) do not differ between conditions. F: Feedback only; I+F instruction and Feedback.
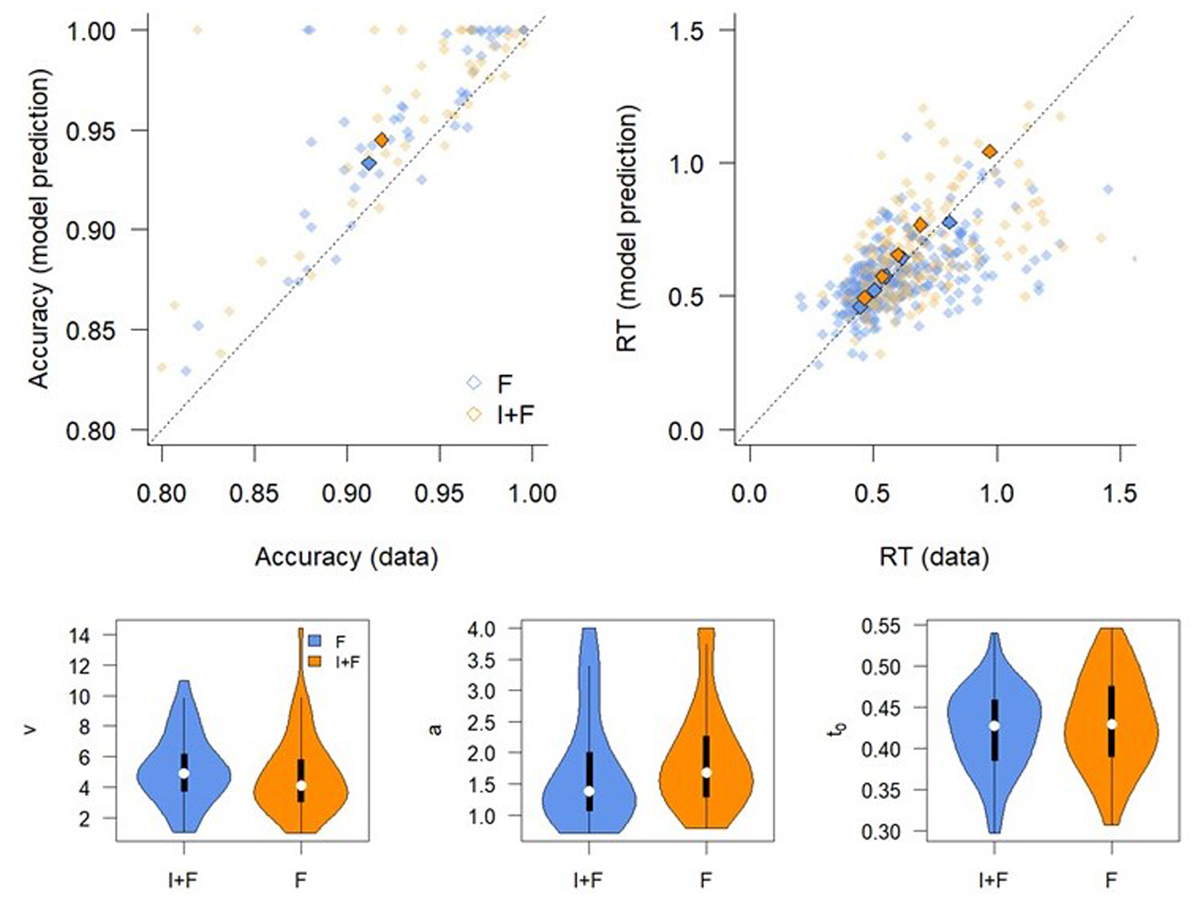
Figure 9
Fit of Diffusion Decision Model (Top panel) and model parameters (Bottom panel) reveal that there are no lasting effects of instruction. Top. QQ-plots of model fits. Individual data points refer to individuals, thick shapes indicate the mean of the 0.1, 0.3, 0.5, 0.7, and 0.9 quantile RTs. Bottom. Parameter estimates. Left: drift rate; Middle: boundary separation; Right: non-decision time. I+F: Instruction and feedback; F: feedback only.