
Figure 1
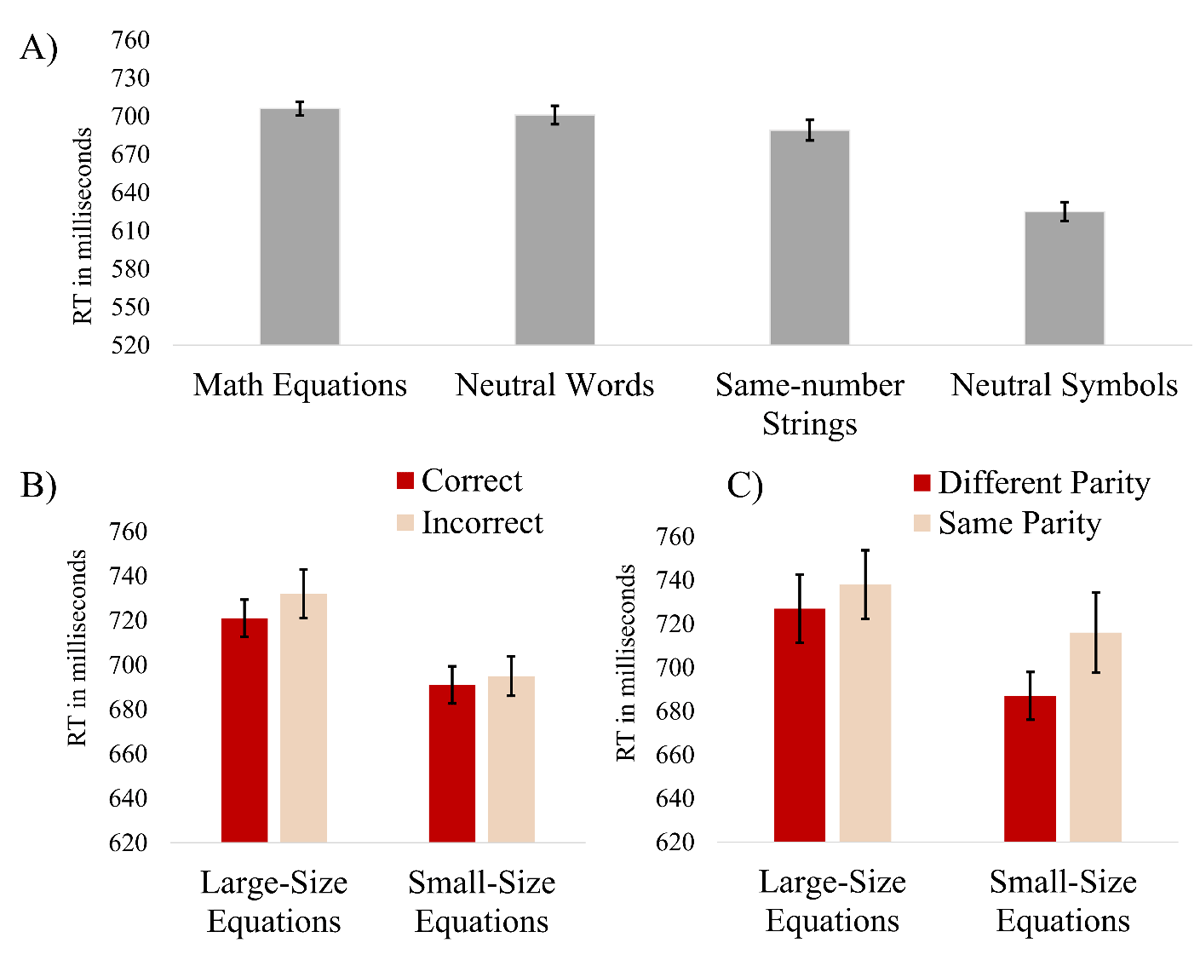
Mean reaction times of the different experiment conditions.
Note. Panel A – mean reaction times (RTs) of the different stimulus type conditions. Panel B – RTs for incorrect (e.g., 4 × 6 = 23) and correct equations (e.g., 4 × 6 = 24) as a function of equations’ size. Panel C – RTs for incorrect equations as a function of equations’ size and parity of the incorrect results. Error bars represent one standard error from the mean (using Cousineau’s (2005) method to compute the error bars in within-subject designs).
Table 1
Math equations that were used in the present study.
| CORRECT SMALL | CORRECT LARGE | INCORRECT SAME-PARITY SMALL | INCORRECT SAME-PARITY LARGE | INCORRECT DIFFERENT-PARITY SMALL | INCORRECT DIFFERENT-PARITY LARGE |
|---|---|---|---|---|---|
| 2 × 4 = 8 | 4 × 8 = 32 | 2 × 4 = 10 | 4 × 8 = 30 | 2 × 4 = 9 | 4 × 8 = 31 |
| 2 × 6 = 12 | 4 × 9 = 36 | 2 × 6 = 10 | 4 × 9 = 34 | 2 × 6 = 11 | 4 × 9 = 35 |
| 2 × 7 = 14 | 5 × 7 = 35 | 2 × 7 = 16 | 5 × 7 = 37 | 2 × 7 = 15 | 5 × 7 = 34 |
| 2 × 8 = 16 | 5 × 9 = 45 | 2 × 8 = 14 | 5 × 9 = 43 | 2 × 8 = 17 | 5 × 9 = 44 |
| 3 × 5 = 15 | 5 × 8 = 40 | 3 × 5 = 13 | 5 × 8 = 38 | 3 × 5 = 16 | 5 × 8 = 39 |
| 3 × 6 = 18 | 6 × 5 = 30 | 3 × 6 = 20 | 6 × 5 = 32 | 3 × 6 = 17 | 6 × 5 = 31 |
| 3 × 7 = 21 | 6 × 7 = 42 | 3 × 7 = 23 | 6 × 7 = 40 | 3 × 7 = 22 | 6 × 7 = 41 |
| 3 × 8 = 24 | 6 × 8 = 48 | 3 × 8 = 22 | 6 × 8 = 46 | 3 × 8 = 23 | 6 × 8 = 49 |
| 3 × 9 = 27 | 7 × 5 = 35 | 3 × 9 = 29 | 7 × 5 = 37 | 3 × 9 = 28 | 7 × 5 = 36 |
| 4 × 2 = 8 | 7 × 8 = 54 | 4 × 2 = 10 | 7 × 8 = 56 | 4 × 2 = 7 | 7 × 8 = 57 |
| 4 × 3 = 12 | 7 × 9 = 63 | 4 × 3 = 14 | 7 × 9 = 65 | 4 × 3 = 13 | 7 × 9 = 62 |
| 4 × 6 = 24 | 8 × 4 = 32 | 4 × 6 = 26 | 8 × 4 = 34 | 4 × 6 = 23 | 8 × 4 = 31 |
| 5 × 2 = 10 | 8 × 5 = 40 | 5 × 2 = 8 | 8 × 5 = 42 | 5 × 2 = 9 | 8 × 5 = 41 |
| 5 × 3 = 15 | 8 × 6 = 48 | 5 × 3 = 17 | 8 × 6 = 50 | 5 × 3 = 14 | 8 × 6 = 47 |
| 6 × 2 = 12 | 8 × 7 = 56 | 6 × 2 = 14 | 8 × 7 = 58 | 6 × 2 = 13 | 8 × 7 = 57 |
| 6 × 4 = 24 | 9 × 5 = 45 | 6 × 4 = 22 | 9 × 5 = 47 | 6 × 4 = 25 | 9 × 5 = 46 |
| 7 × 2 = 14 | 9 × 6 = 54 | 7 × 2 = 16 | 9 × 6 = 56 | 7 × 2 = 13 | 9 × 6 = 53 |
| 9 × 3 = 27 | 9 × 7 = 63 | 9 × 3 = 29 | 9 × 7 = 61 | 9 × 3 = 26 | 9 × 7 = 64 |
[i] * All equations could randomly appear in one of 4 colors. Note that equations that included the number 5 were presented to participants but were excluded from the analysis. The color-to-equation pairing was random.
Table 2
Non-equation stimuli that were used in the present study.
| SAME-NUMBER STRINGS | NEUTRAL-SYMBOLS | NEUTRAL-WORDS | PRESENTED COLOR |
|---|---|---|---|
| 999999 | ^^^^ | בורג Screw | Blue |
| 111111 | $$ | מגמה Tendency | Green |
| 444444 | #### | טופס Form | Yellow |
| 888888 | @@@@ | בנין Building | Red |
[i] Note that the neutral-words appeared in Hebrew.
Table 3
Frequencies and proportions of the presented stimuli.
| MATH EQUATIONS | OVERALL FREQUENCY | OVERALL PROPORTION | PROPORTION WITHIN MATH EQUATIONS |
|---|---|---|---|
| Correct Small | 60 | 7.08% | 16.66% |
| Correct Large | 60 | 7.08% | 16.66% |
| Incorrect Same-Parity Small | 60 | 7.08% | 16.66% |
| Incorrect Same-Parity Large | 60 | 7.08% | 16.66% |
| Incorrect Different-Parity Small | 60 | 7.08% | 16.66% |
| Incorrect Different-Parity Large | 60 | 7.08% | 16.66% |
| NON-MATH EQUATIONS | PROPORTION WITHIN NON-MATH EQUATIONS | ||
| Neutral-words | 64 (56.8) | 7.5% | 13.25% |
| Same-number strings | 64 (57.4) | 7.5% | 13.25% |
| Neutral-symbols | 360 (335) | 42.5% | 73.5% |
[i] Note that these numbers represent the total number of stimuli that were presented and not the number of trials in a single block. In parentheses are the average amount of trials that were analyzed per participant for each stimulus-type condition after all the exclusions (extreme RTs, Incorrect responses, and non-five operand equations).