
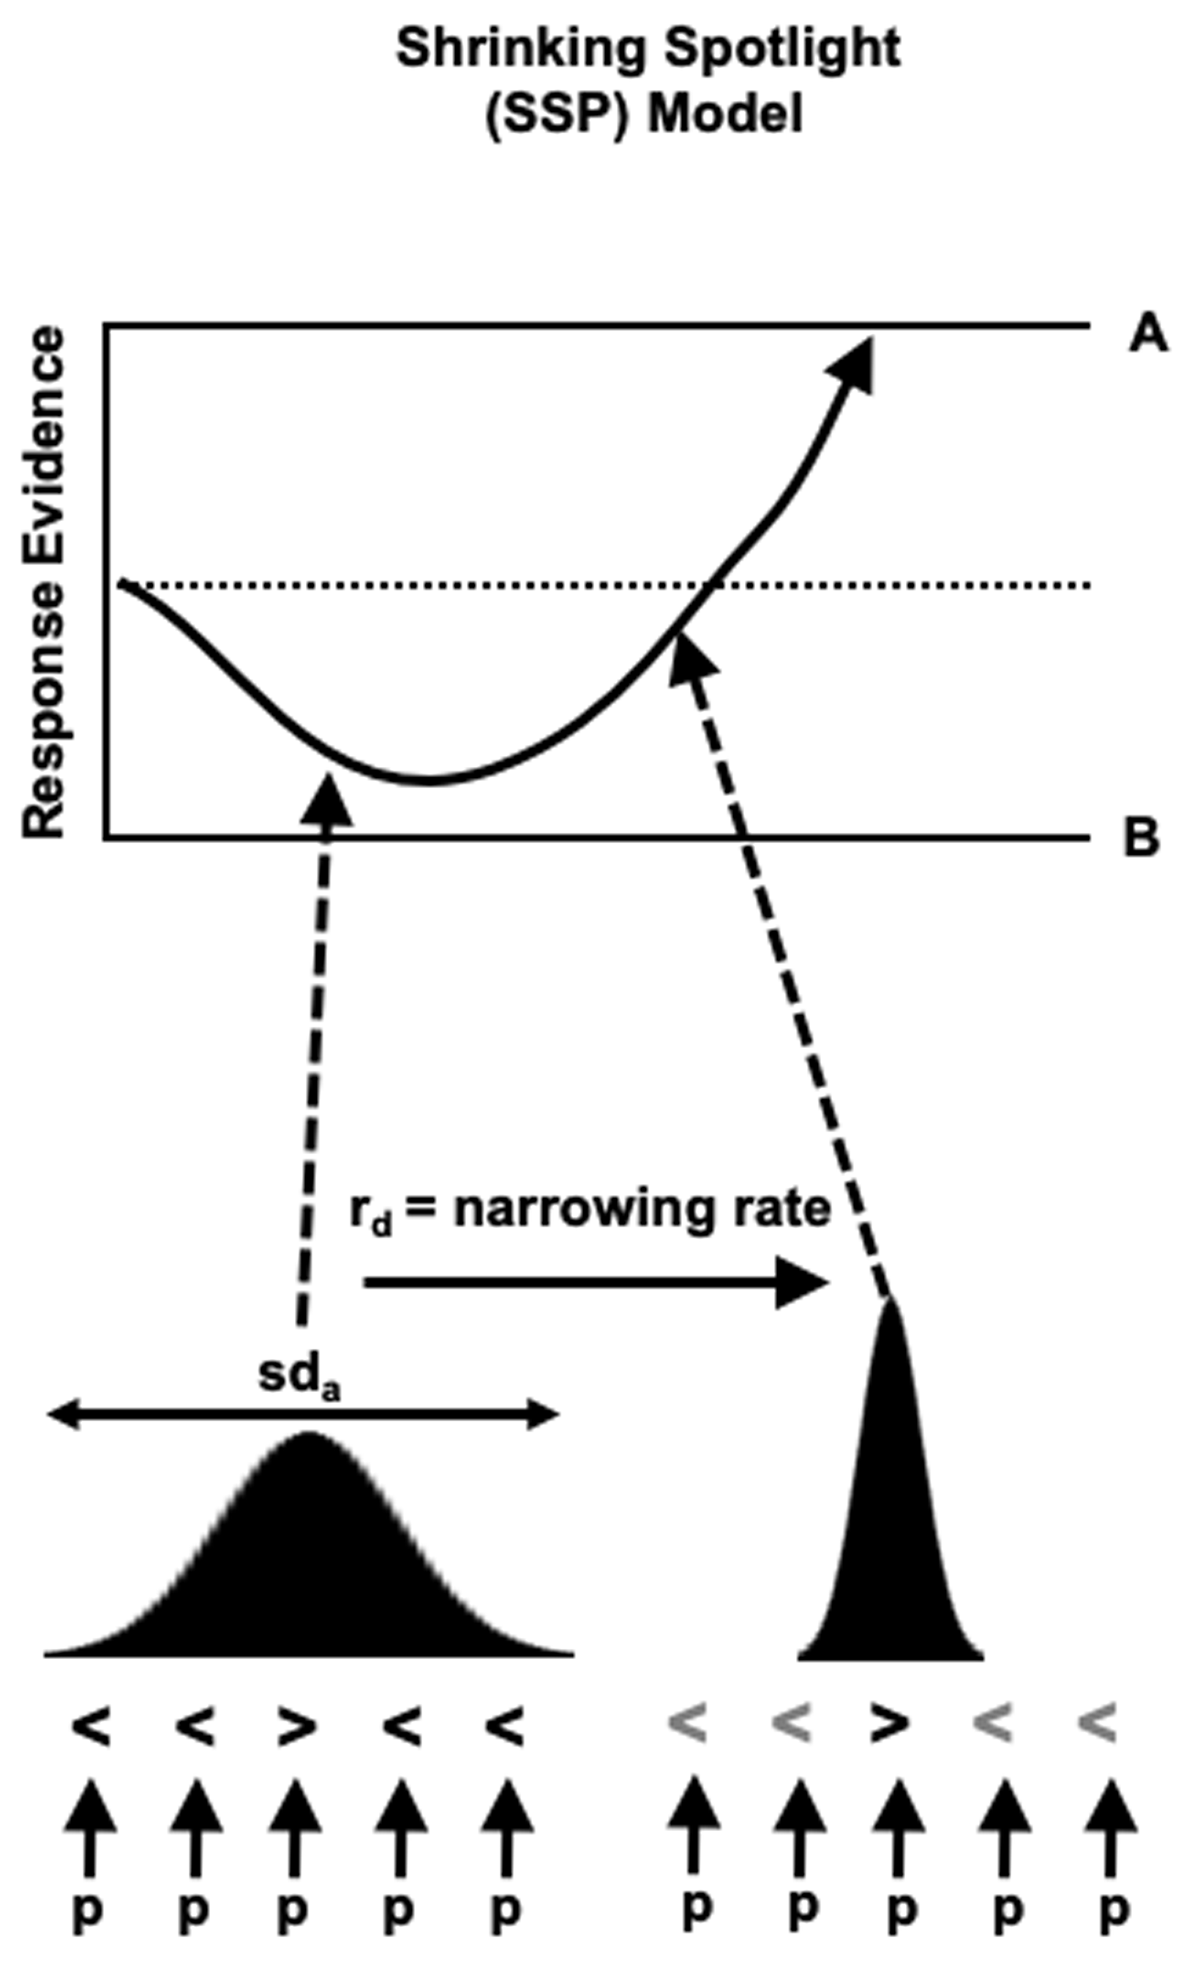
Figure 1
Schematic of response selection process on an incongruent trial on the flanker task according to the Shrinking Spotlight Model (SSP). The drift rate of the evidence accumulation process (arrow in top panel) is determined by all stimuli which fall under the attentional spotlight (Gaussian distribution in bottom panel). Early in the trial both the central target and foils contribute to the drift rate. Over time, the spotlight narrows on the target and the foils are suppressed. The SSP can account for typical observations on the task: more time is required to suppress the foils and resolve the conflict on incongruent trials compared with congruent trials where foil and target are the same meaning evidence accumulation process will rapidly reach the correct boundary. Fast errors are more likely on incongruent trials where the evidence accumulation process is more likely to hit the wrong boundary. Figure adapted from https://flickr.com/photos/150716232@N04/48957578602 which is available under CC licence https://creativecommons.org/licenses/by/2.0/.
Table 1
Summary of studies using the flanker task to investigate visual spatial selective attention in autism. ‘Differences overall’ indicates where there were response time or accuracy differences between the groups which were not modulated by condition. ‘Foil interference’ indicates whether response time/accuracy measures of foil interference were increased (↑), decreased (↓), or not different (=) in the autistic group relative to non-autistic group (according to studies own criterion, assumed to be ɑ < .05 if not specified).
| STUDY | PARTICIPANTS | CONDITIONS | STIMULI | DIFFERENCES OVERALL | FOIL INTERFERENCE | NOTES |
|---|---|---|---|---|---|---|
| Adams & Jarold (2012) | 15 autistic, 15 non-autistic (learning disabled) & 15 non-autistic children (age 8–17) | Congruent, incongruent | Arrow | – | ↑ | Manipulated target size, distance between foil and target. Autistic group performance not modulated by these manipulations. |
| Boland et al (2019) | 36 autistic & 44 non-autistic children/adults (age 11–20) | Congruent, incongruent | Arrow (fish) | – | = | |
| Brandes-Aitken et al (2018) | 14 autistic, 14 sensory processing dysfunction & 14 neurotypical children (age 9–11) | Congruent, incongruent | Arrow | – | = | |
| Brodeur et al (2018) | 13 autistic & 13 non-autistic children (age 5–13) | Neutral, no foils | Symbols | Response times increased in no foil condition in autistic group | ↓ | Increasing delay of foils increased autistic group response times. No effect of spatial distance. |
| Christ et al, (2007) | 18 autistic and 23 non-autistic children (age 6–15) | Congruent, incongruent, neutral | Letters, symbols | Response times and errors increased in autistic group | ↑ | Four possible targets, two mapped to each response button. Groups differed on age, gender and IQ |
| Christ et al (2011) | 28 autistic and 49 non-autistic children (age 8–18) | Congruent, incongruent | Arrow (fish) | Errors increased in autistic group | ↑ | |
| Dichter & Belger (2008) | 12 autistic and 22 non-autistic adults (age 18–38) | Congruent, incongruent, neutral | Arrow | Response times reduced in autistic group | ↑ | Trials preceded by high and low ‘arousal’ images |
| Dichter & Belger, (2007) | 17 autistic and 15 non-autistic adults (age 20–28) | Congruent, incongruent, neutral | Arrow Eye Gaze | – | = | FMRI – congruency modulated neural response to gaze stimuli reduced in autistic group |
| Faja et al (2016) | 19 autistic and 30 non-autistic children (age 7–11) | Congruent, incongruent | Arrow (fish) | Errors and response times increased in autistic group | ↑ & ↓ | ERP measured – N2 component increased in autistic group but not modulated by group |
| Henderson et al (2006) | 24 autistic and 17 non-autistic children (age 10–12) | Congruent, incongruent | Arrow | Errors increased in autistic group | = | Presentation of stimuli and time to respond calibrated based on performance. ERP measure of error related negativity no difference in amplitude between groups |
| Keehn et al (2010) | 20 autistic and 20 non-autistic children (age 8–19) | Congruent, incongruent, neutral | Arrow | – | = | Attention network test. |
| Montgomery et al (2022) | 38 autistic and 50 non-autistic children (age 6–14) | Congruent, incongruent | Arrow | – | = | |
| Samyn et al (2014) | 20 autistic, 24 ADHD & 21 neurotypical children (age 10–15) | Congruent, incongruent | Arrow | – | = | ERP measures: N2 amplitudes similar, P3, ERN similar between autistic and non-autistic groups |
| Sanderson & Allen (2013) | 31 autistic and 28 non-autistic children (age 8–14) | Congruent, incongruent, neutral | Arrow | Response times reduced in autistic group | = | |
| South et al (2010) | 24 autistic and 21 non-autistic children (age 8–18) | Congruent, incongruent | Arrow (foils were chevrons) | – | = | 60% of trials incongruent Measured error monitoring – error related negativity reduced |
| Van Eylen et al (2015) | 50 autistic and 50 non-autistic children (11–13) | Congruent, incongruent | Arrows | – | = |
Table 2
Demographic information and questionnaire score of the final sample. International Cognitive Ability Resource Score (ICAR-16; Condon & Revelle, 2014) is a measure of general cognitive ability, described in detail below. Ritvo Autism and Aspergers Diagnostic Scale (RAADS-14) is an autism screening questionnaire (described below). The Cognitive Failures Questionnaire (CFQ; Broadbent, Cooper, FitzGerald & Parkes, 1982). is a measure of everyday cognitive functioning (described and analysed in the supplementary materials, S2). Detailed demographic information regarding participant sex at birth, gender, race, neurodivergence other than autism, mental health and any medications is available in S1 of the supplementary materials (see https://osf.io/w6fjm/).
| GROUP | AGE (YEARS) | SEX AT BIRTH | ICAR-16 | RADS-14 | CFQ |
|---|---|---|---|---|---|
| Autistic | 31.20 (SD = 7.23) | 99 Female 43 Male 2 Intersex | 7.66 (SD = 3.63) | 30.20 (SD = 8.28) | 57.50 (SD = 20.06) |
| Non-Autistic | 33.60 (SD = 6.43) | 94 Female 52 Male | 6.95 (SD = 3.62) | 10.20 (SD = 9.06) | 31.42 (SD = 18.58) |
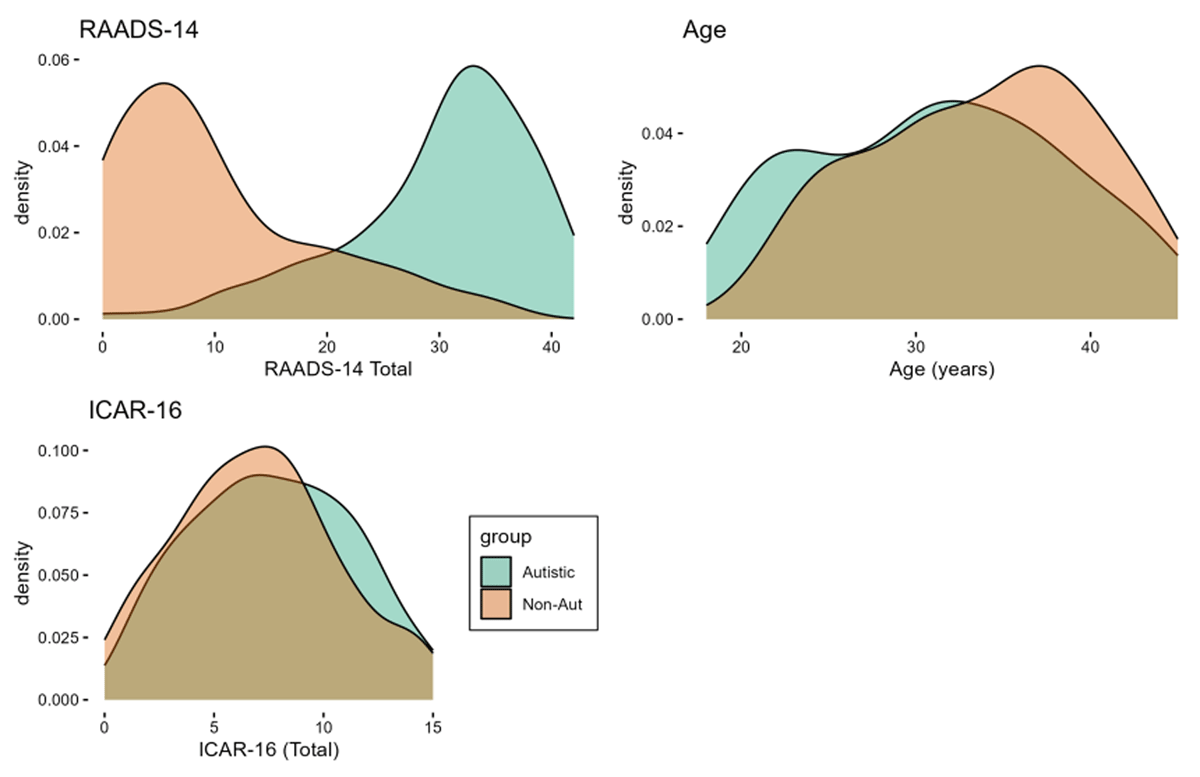
Figure 2
Density plots displaying autistic (green) and non-autistic (orange) group scores on the RAADS-14, age and ICAR-16. As can be seen from the figure, the groups were well matched for age and total score on the ICAR-16. As would be expected, the autistic group scored much higher on the RAADS-14 compared with the non-autistic group.
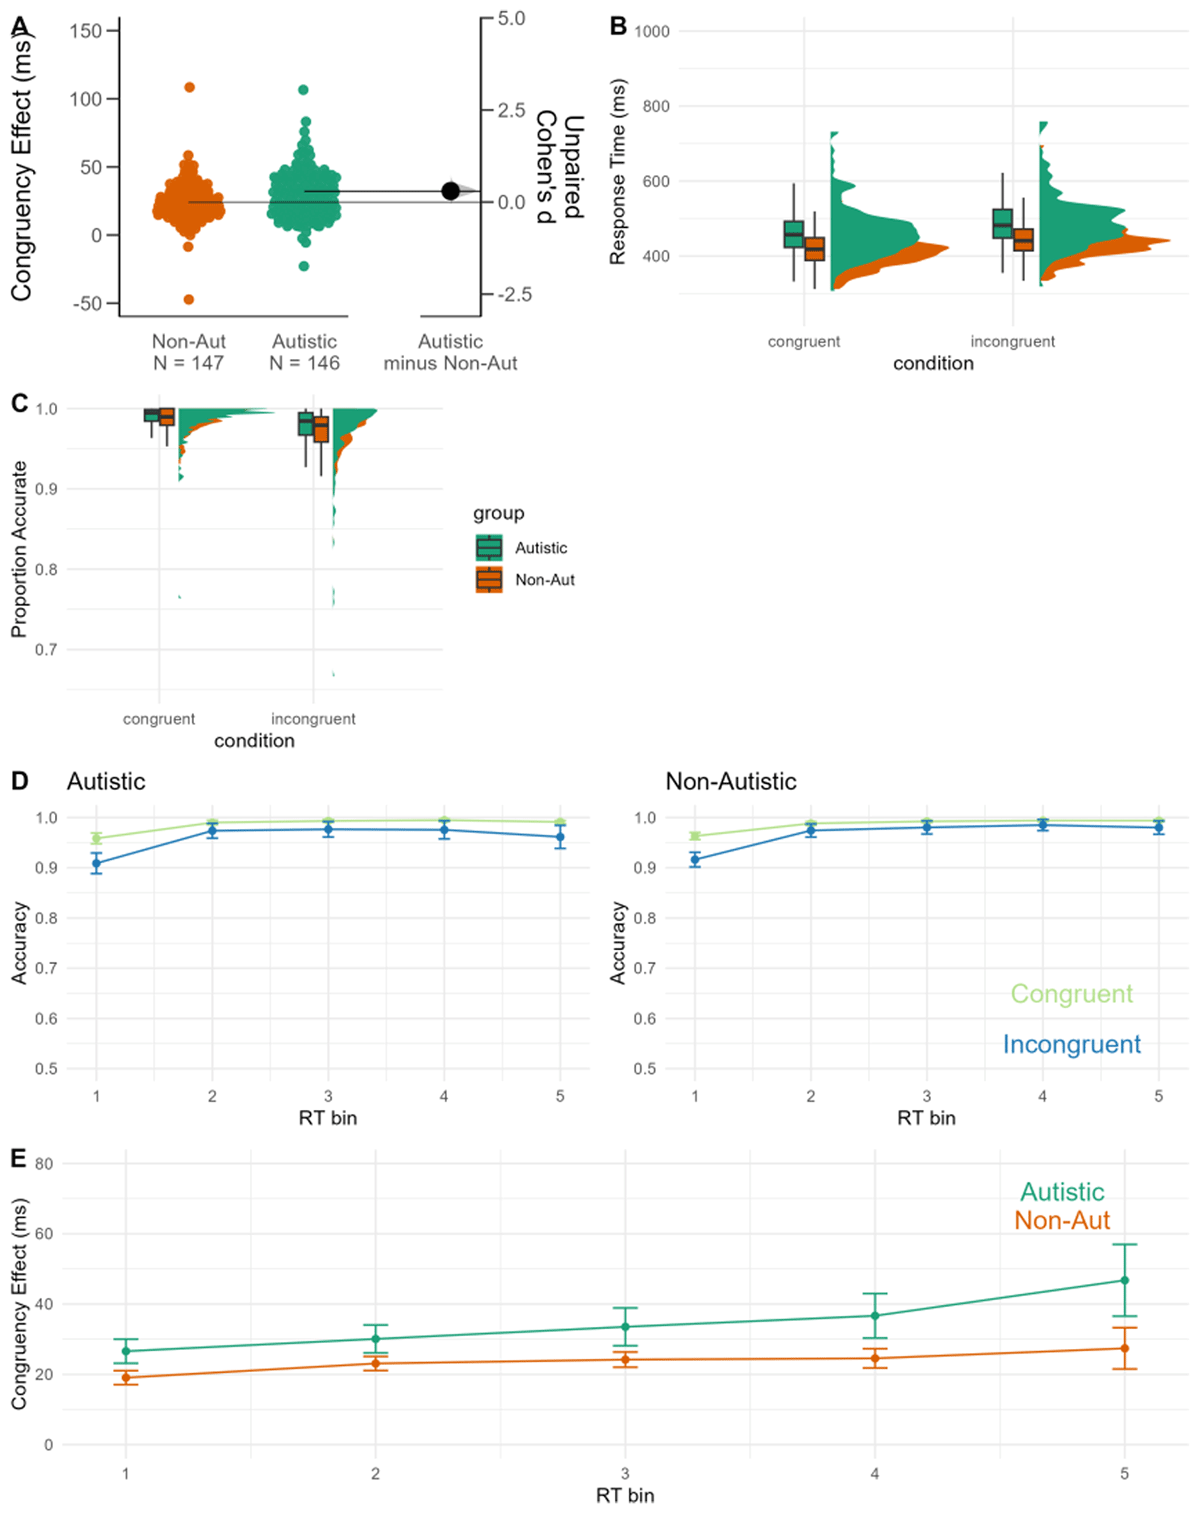
Figure 3
Data from the flanker task. A: Gardener-Altmann plot displaying the congruency effect (incongruent – congruent response times) for autistic (green) and non-autistic (orange) participants. B: Raincloud plot displaying the response time data C: raincloud plot displaying the accuracy data. D: Conditional Accuracy Functions for the autistic (left) and non-autistic (right) groups. E: Delta plot for autistic (green) and non-autistic (orange) participants. Regression models (non-pre-registered) with response time and accuracy as outcomes are reported in supplementary materials S6.
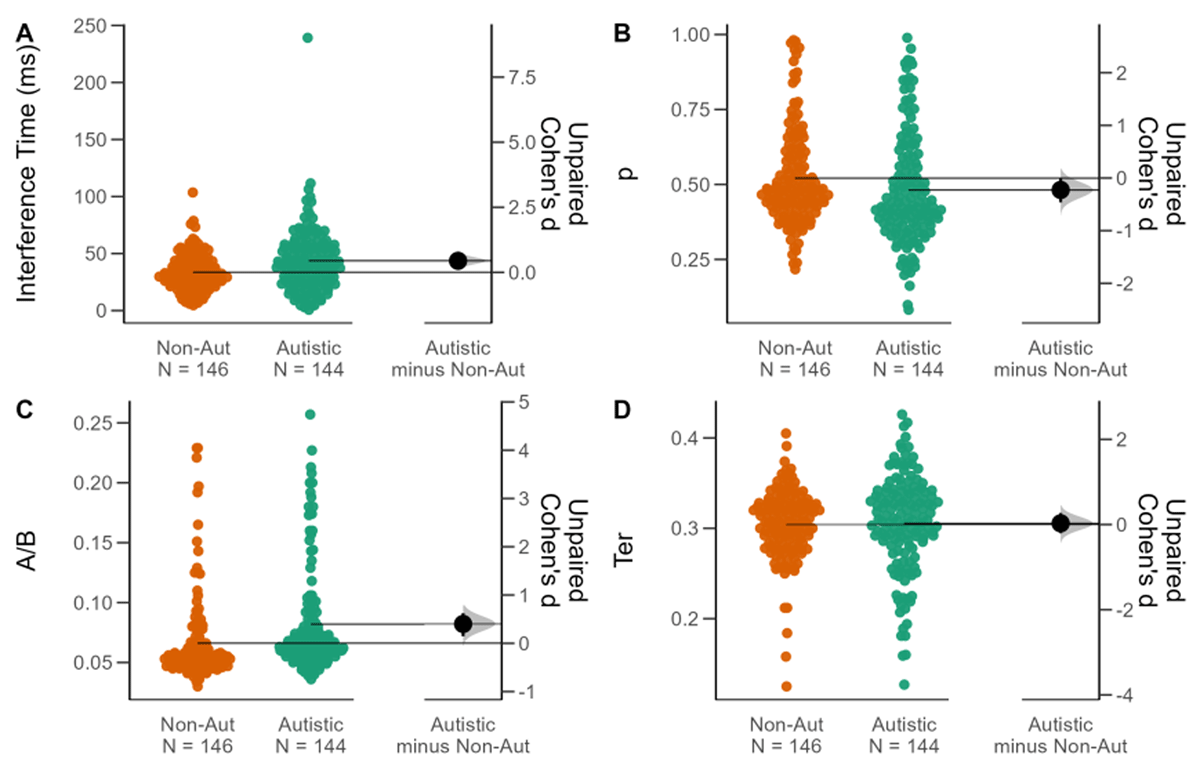
Figure 4
Gardner-Altmann plot displaying the the autistic group (green) and non-autistic group (orange) parameters estimated using the Shrinking Spotlight Model A: interference time (sd/rd) B: perceptual sensitivity (p) C: Boundary separation (A/B) D: non-decision time (Ter).
Table 3
Descriptive and test statistics for comparison of parameter estimates perceptual sensitivity (p), boundary separation (A/B) and non-decision time (Ter) for the Autistic (A) and Non-Autistic (NA) groups.
| PARAM | A MEAN (SD) | NA MEAN (SD) | U | p | MEAN DIFFERENCE [CI] | d [CI] |
|---|---|---|---|---|---|---|
| p | 0.48 (0.19) | 0.52 (0.16) | 8577.50 | .006 | –0.04 [–0.07, <.001] | –0.23 [–0.46, <.01] |
| A/B | .082(.044) | .066 (.036) | 14420 | <.001 | 016 [.006,.026] | 0.40 [0.15, 0.62] |
| Ter | 0.31 (0.05) | 0.30 (0.04) | 11129 | .388 | <.01 [–.01,.01] | 0.03 [–0.20, 0.27] |