
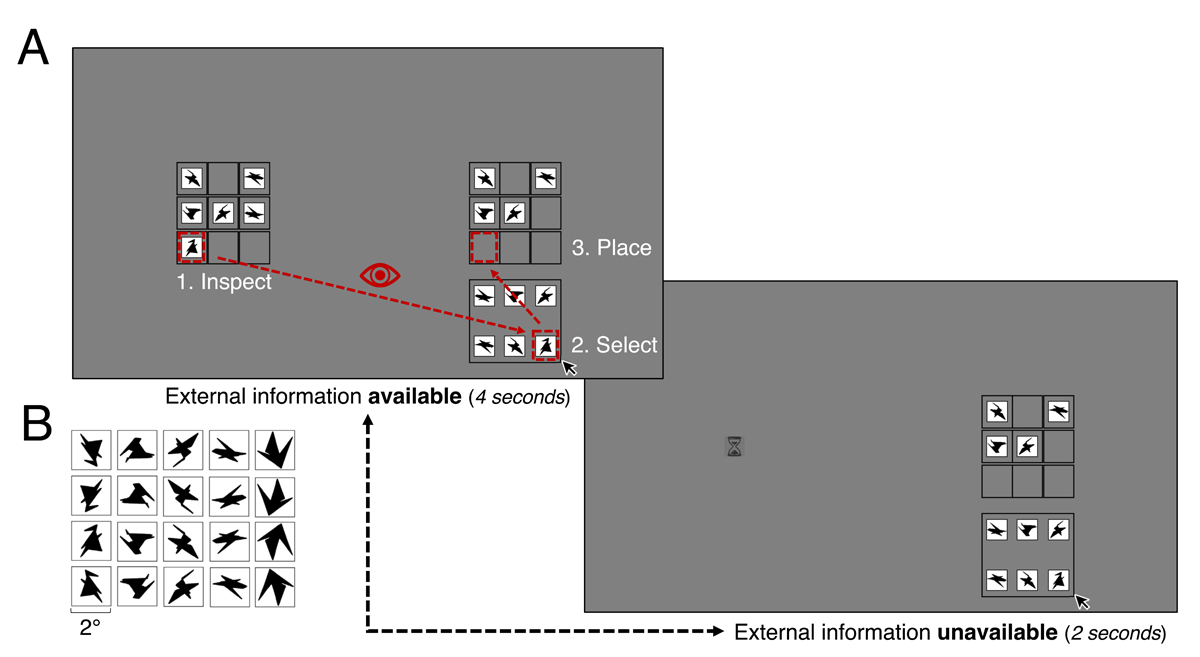
Figure 1
A. Example of a partially completed trial in the High availability condition in Experiment 1. In this example, four items have already been dragged to their correct position. The example grid alternated between available and unavailable throughout a trial, and this was repeated until the trial was completed. B. Stimuli as adapted from Arnoult (1956). In each column there is a unique shape, each mirrored horizontally, vertically, and diagonally; 20 stimuli in total. Each stimulus occupied approximately 2° of visual angle.
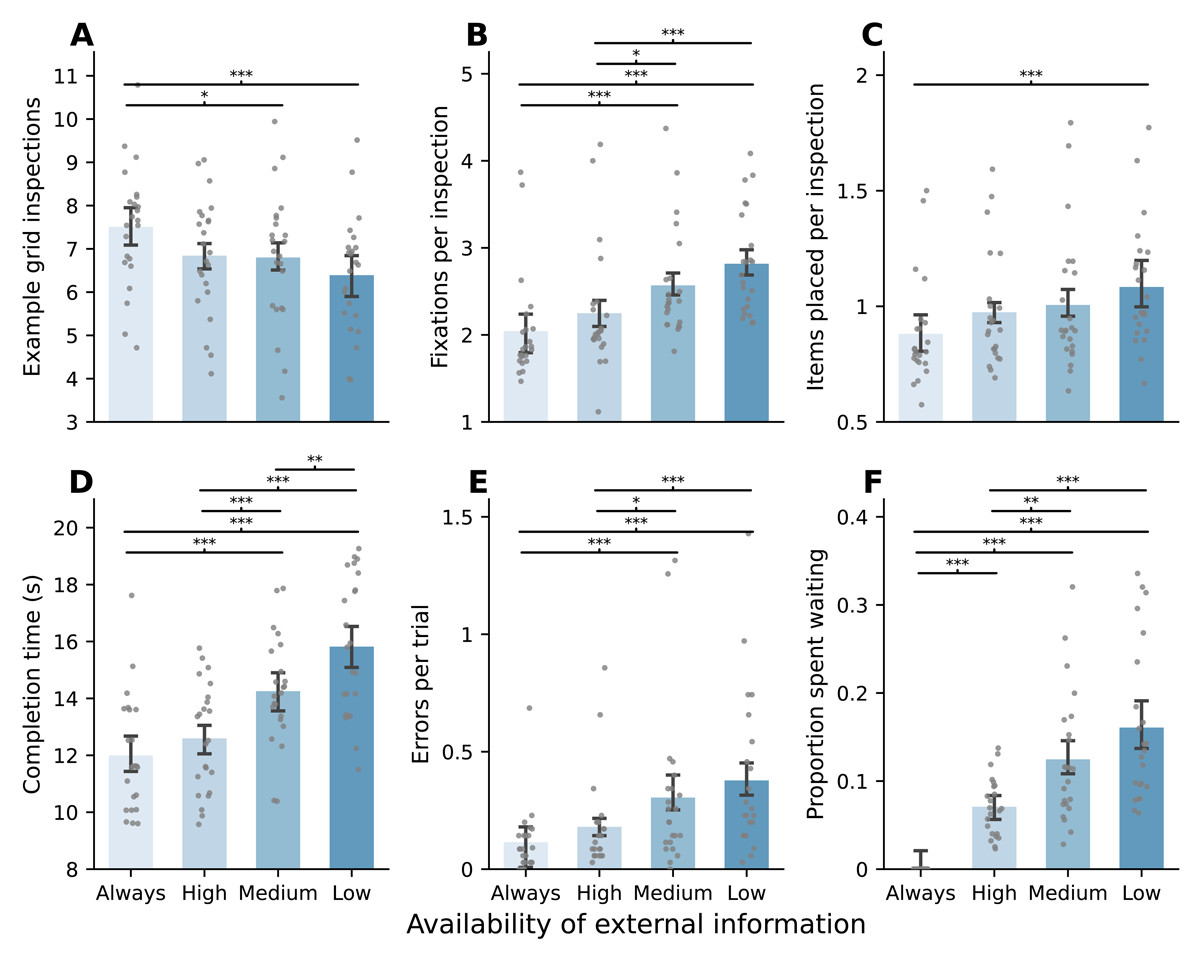
Figure 2
Barplots (mean ± 95% within-subjects CI) for each variable, per condition. Individual points represent within-participant aggregates. A. The average number of inspections of the example grid per trial. B. The average number of fixations made on the example grid per inspection. C. The average number of correctly placed items per inspection. D. The median completion time (in seconds). Time spent fixating at the example grid while it was occluded was subtracted. E. The average number of incorrectly placed items per trial. F. The average proportion spent fixating at the example grid location while it was occluded.
Note: Post-hoc paired samples t-tests (Bonferroni corrected); *p < .05, **p < .01, ***p < .001.
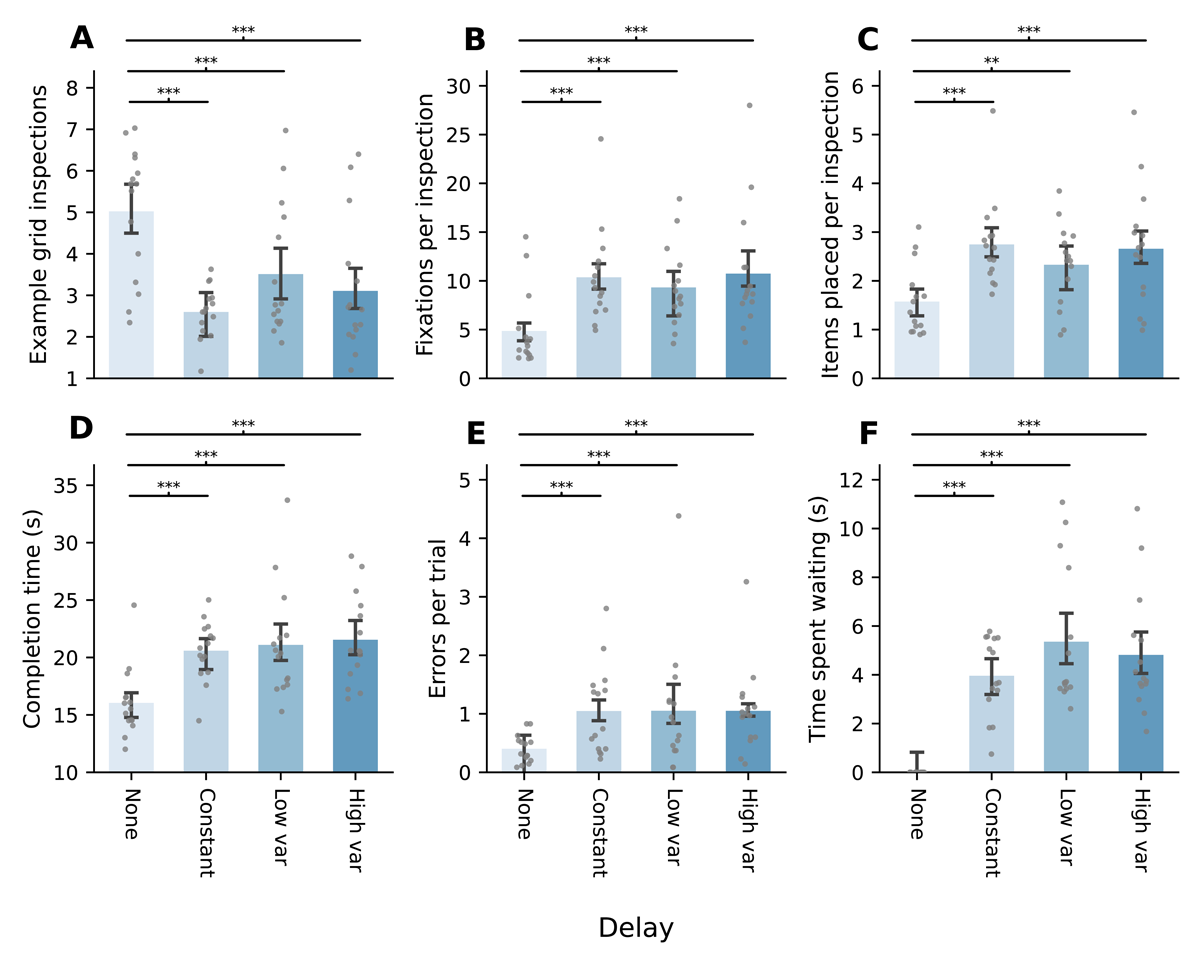
Figure 3
Barplots (mean ± 95% within-subjects CI) for each variable, per condition. Individual points represent within-participant aggregates. A. The average number of inspections of the example grid per trial. B. The average number of fixations made on the example grid per inspection. C. The average number of correctly placed items per inspection. D. The median completion time (in seconds). Time spent fixating at the example grid while it was occluded was subtracted. E. The average number of incorrectly placed items per trial. F. The median time per trial spent fixating at the example grid location while serving the delay period.
Note: Post-hoc paired samples t-tests (Bonferroni corrected); *p < .05, **p < .01, ***p < .001.
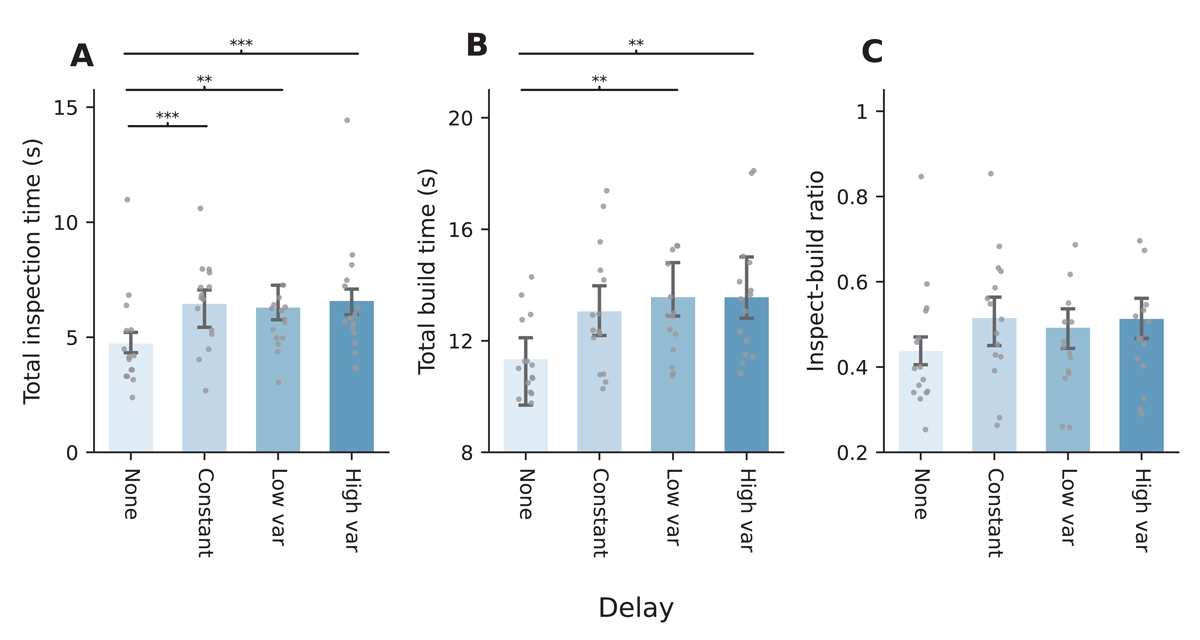
Figure 4
Barplots (mean ± 95% within-subjects CI) for each variable, per condition. Individual points represent within-participant aggregates. A. The median time spent inspecting the example grid, in seconds. B. The median time spent building on the right side of the screen, in seconds. C. The ratio between time spent inspecting and time spent building.
Note: Post-hoc paired samples t-tests (Bonferroni corrected); *p < .05, **p < .01, ***p < .001.