
Figure 1
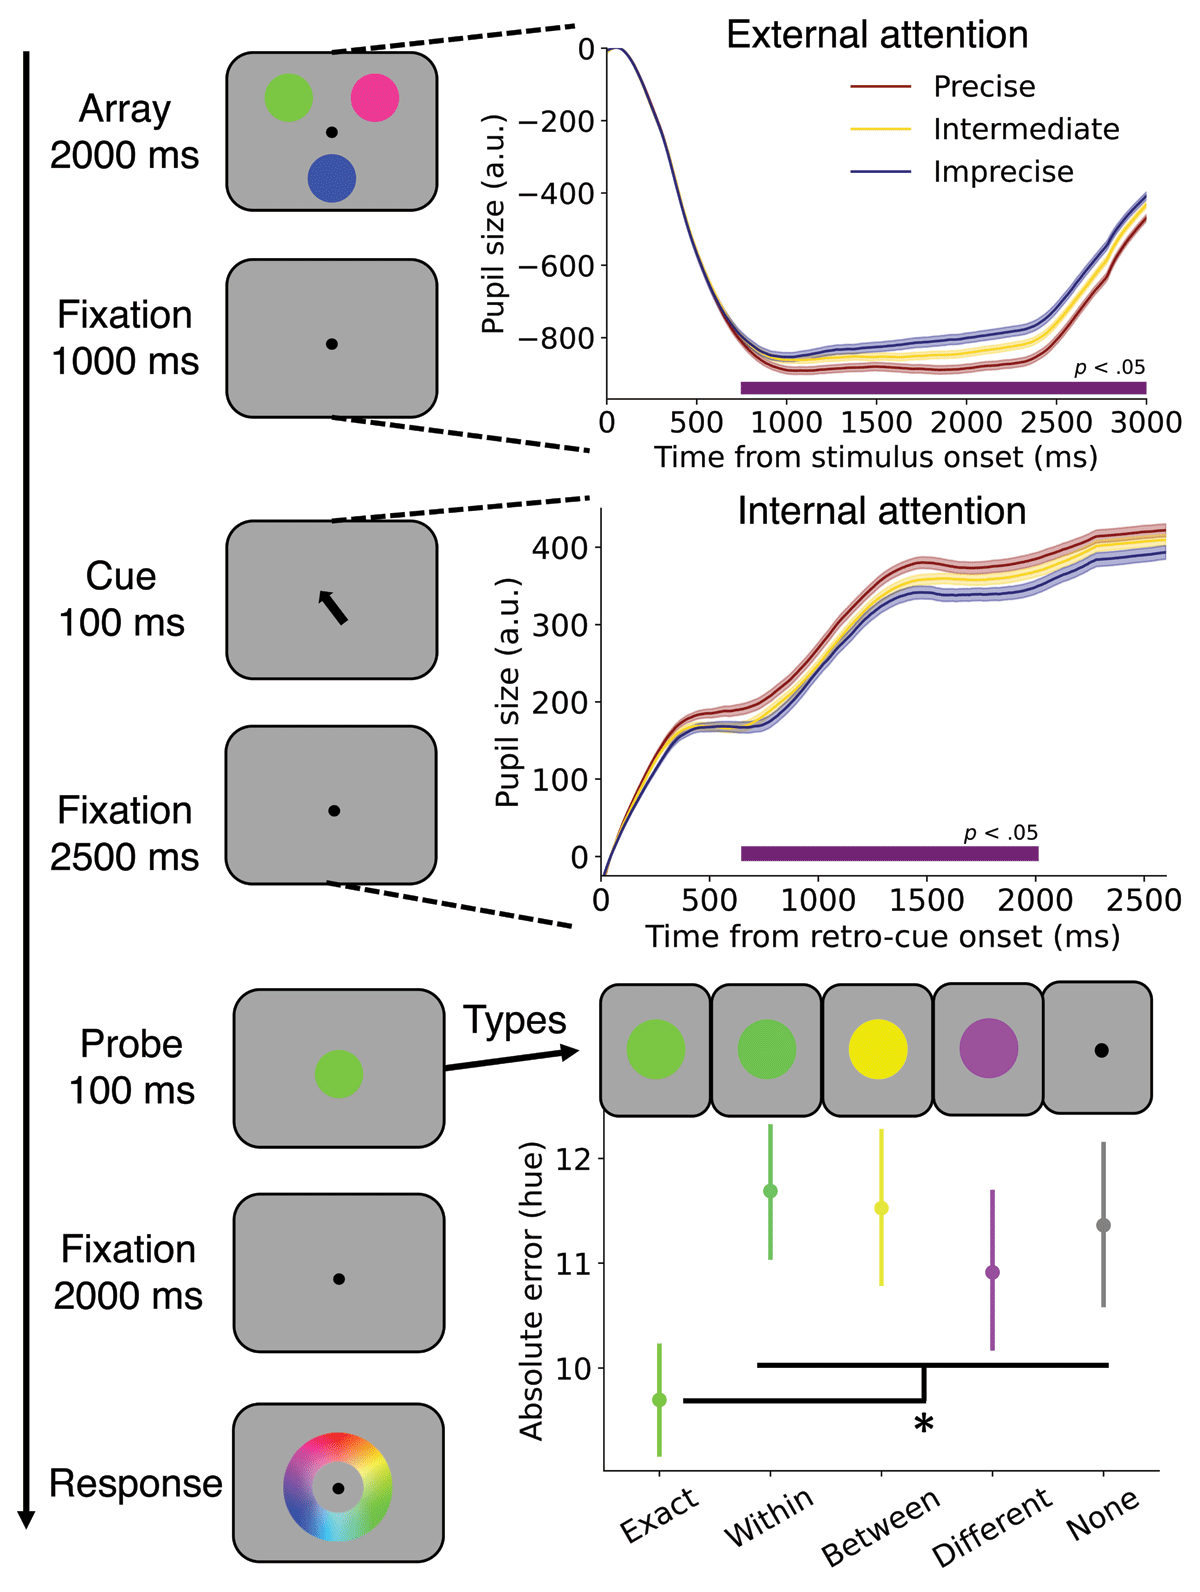
Schematic overview of the procedure and the main results. Left: Procedure from top to bottom, see Methods for details. Top right: Pupil constriction was more pronounced during more precise encoding into VWM as indicated by smaller absolute hue errors. For visualization only, three groups were created for the pupil trace plots but analyses were conducted using absolute error as a continuous variable. Horizontal purple lines indicate significant effects of absolute error on pupil size (p < .05). The X-axis represents time (ms) and the Y-axis holds pupil size (arbitrary units). Middle right: Stronger dilation during prioritization leads to more precise VWM representations (same conventions as above). Bottom right: Probe conditions differed in absolute hue errors. All error shadings and bars reflect standard errors of the mean. *p < .05.
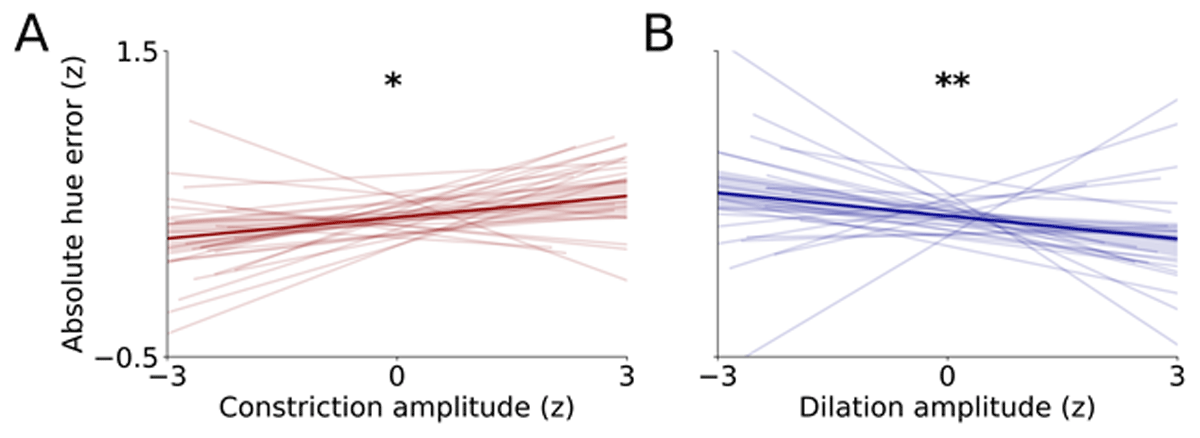
Figure 2
Relationships between visual working memory precision and A) encoding constriction amplitude (external attention), and B) prioritization dilation amplitude (internal attention). Thin lines represent linear fits per individual and the thick like represents the relationship across all data. Shaded error bars represent bootstrapped 95% confidence intervals. Y-axes are shared between A and B. To account for individual differences, data were normalized to robust z-scores by subtracting the median and dividing by the median absolute deviation for each datapoint per participant (Rousseeuw & Hubert, 2011). *p < .05, **p < .01.