
Table 1
Descriptive and Correlation Analyses for Study Variables.
| VARIABLES | M | SD | PEARSON CORRELATIONS | ||||
|---|---|---|---|---|---|---|---|
| 1 | 2 | 3 | 4 | 5 | |||
| Mini-Addenbrooke (M-ACE) | 15.33 | 6.34 | — | ||||
| M-ACE Attention/Orientation | 2.75 | 1.32 | .68*** | — | |||
| M-ACE Memory | 7.48 | 3.46 | .89*** | .47*** | — | ||
| M-ACE Fluency | 2.71 | 1.67 | .73*** | .42*** | .48*** | — | |
| M-ACE Visuospatial | 2.39 | 1.59 | .72*** | .42*** | .48*** | .46*** | — |
| Mini-Mental State Examination (MMSE) | 22.41 | 4.99 | .67*** | .69*** | .51*** | .48*** | .48*** |
| MMSE-Attention | 2.92 | 2.04 | .41*** | .39*** | .31*** | .34*** | .30*** |
| MMSE-Orientation | 7.82 | 2.23 | .65*** | .75*** | .49*** | .44*** | .46*** |
| MMSE-Memory | 4.34 | 1.25 | .37*** | .31*** | .32*** | .26*** | .24*** |
| MMSE-Language | 7.12 | 1.09 | .38*** | .40*** | .30*** | .24*** | .27*** |
| MMSE-Visuospatial Skill | 0.22 | 0.41 | .35*** | .30*** | .22*** | .31*** | .37*** |
| Frontal Assessment Battery (FAB) | 9.37 | 3.80 | .67*** | .55*** | .56*** | .46*** | .52*** |
| FAB-Linguistic | 2.68 | 1.58 | .61*** | .50*** | .46*** | .51*** | .49*** |
| FAB-Planning | 2.81 | 1.84 | .53*** | .42*** | .48*** | .30*** | .40*** |
| FAB-Inhibitory Control | 3.87 | 1.32 | .44*** | .40*** | .36*** | .28*** | .35*** |
| Geriatric Depression Scale-8-Items | 4.26 | 2.77 | -.11 | -.16* | -.02 | -.16* | -.09 |
[i] Note: Correlations between similar domains are highlighted in grey.
*** p < .001. * p < .05.
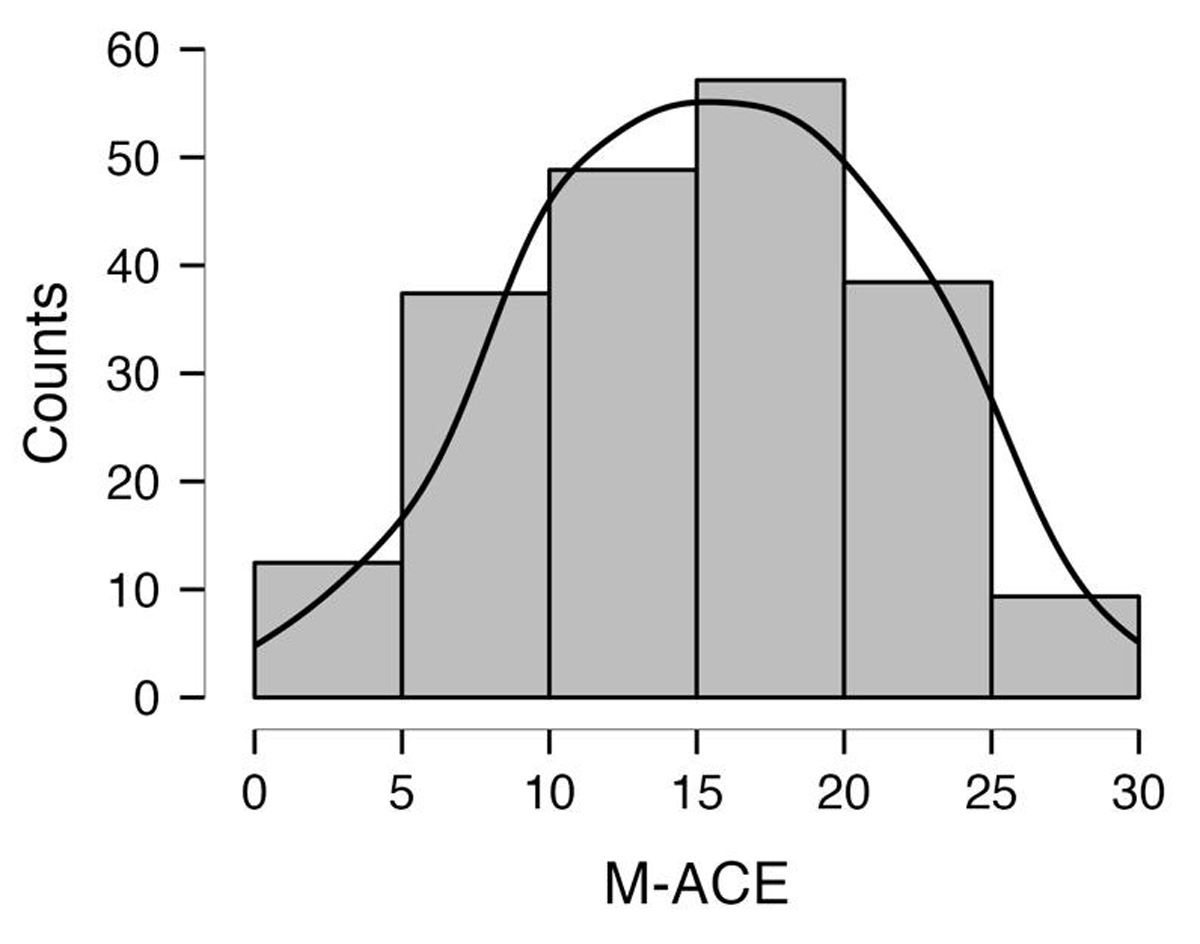
Figure 1
Distribution of M-ACE Scores in Individuals with CIND and Normal Cognition.
Note: M-ACE = Mini-Addenbrooke Cognitive Examination; CIND = cognitive impairment no-dementia.
Table 2
Proportions of Mini-Addenbrooke’s Tasks Failures in CIND and Normal-cognition Groups.
| TASKS | CIND (n = 125) | NORMAL-COGNITION (n = 71) | χ2 | ϕ | ||
|---|---|---|---|---|---|---|
| n | % | n | % | |||
| Attention/Orientation | ||||||
| Weekday | 35 | 28.0 | 4 | 5.6 | 14.21*** | .27 |
| Month day | 75 | 60.0 | 13 | 18.3 | 31.81*** | .40 |
| Month | 24 | 19.2 | 4 | 5.6 | 6.81*** | .19 |
| Year | 60 | 48.0 | 13 | 18.3 | 17.08*** | .30 |
| Memory | ||||||
| First name | 27 | 21.6 | 3 | 4.2 | 10.54*** | .23 |
| Last name | 29 | 23.2 | 6 | 8.5 | 6.72*** | .19 |
| Address street | 36 | 28.8 | 13 | 18.3 | 2.66 | .12 |
| Address name | 59 | 47.2 | 25 | 35.2 | 2.66 | .12 |
| Address number | 46 | 36.8 | 19 | 26.8 | 2.06 | .10 |
| Address town | 47 | 37.6 | 23 | 32.4 | 0.53 | .05 |
| Address district | 35 | 28.0 | 8 | 11.3 | 7.40*** | .19 |
| Semantic Fluency | ||||||
| <5 words | 20 | 16.0 | 2 | 2.8 | 7.90*** | .20 |
| Clock Drawing | ||||||
| Circle | 24 | 19.2 | 2 | 2.8 | 10.56*** | .23 |
| Numbers (0 points) | 60 | 48.0 | 11 | 15.5 | 20.71*** | .33 |
| Hands (0 points) | 97 | 77.6 | 34 | 47.9 | 18.04*** | .30 |
| Memory recall | ||||||
| First name | 82 | 65.6 | 24 | 33.8 | 18.44*** | .31 |
| Second name | 90 | 72.0 | 30 | 42.3 | 16.88*** | .29 |
| Address street | 99 | 79.2 | 26 | 36.6 | 35.54*** | .43 |
| Address street name | 115 | 92.0 | 56 | 78.9 | 7.01*** | .19 |
| Address number | 104 | 83.2 | 36 | 50.7 | 23.43*** | .35 |
| Address town | 97 | 77.6 | 27 | 38.0 | 30.51*** | .39 |
| Address district | 74 | 59.2 | 20 | 28.2 | 17.47*** | .30 |
[i] Note: N = 196. CIND = cognitive impairment no-dementia.
*** p < .001.
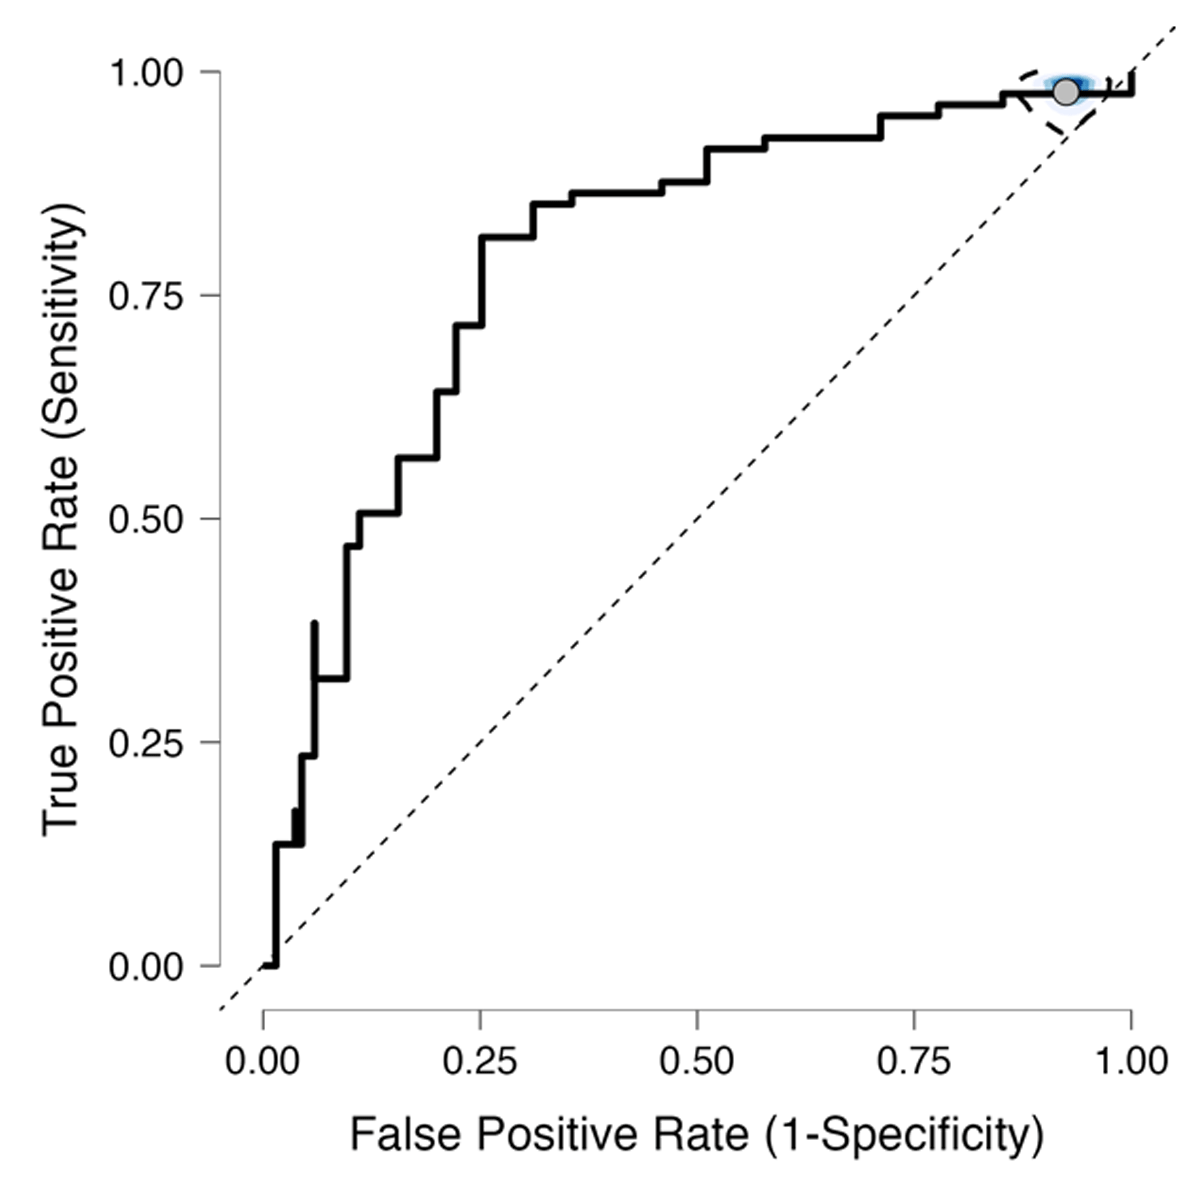
Figure 2
ROC Curve for the M-ACE in Differentiating CIND vs. Normal-cognition.
Note: M-Addenbrooke Cognitive Examination; CIND = cognitive impairment nodementia.
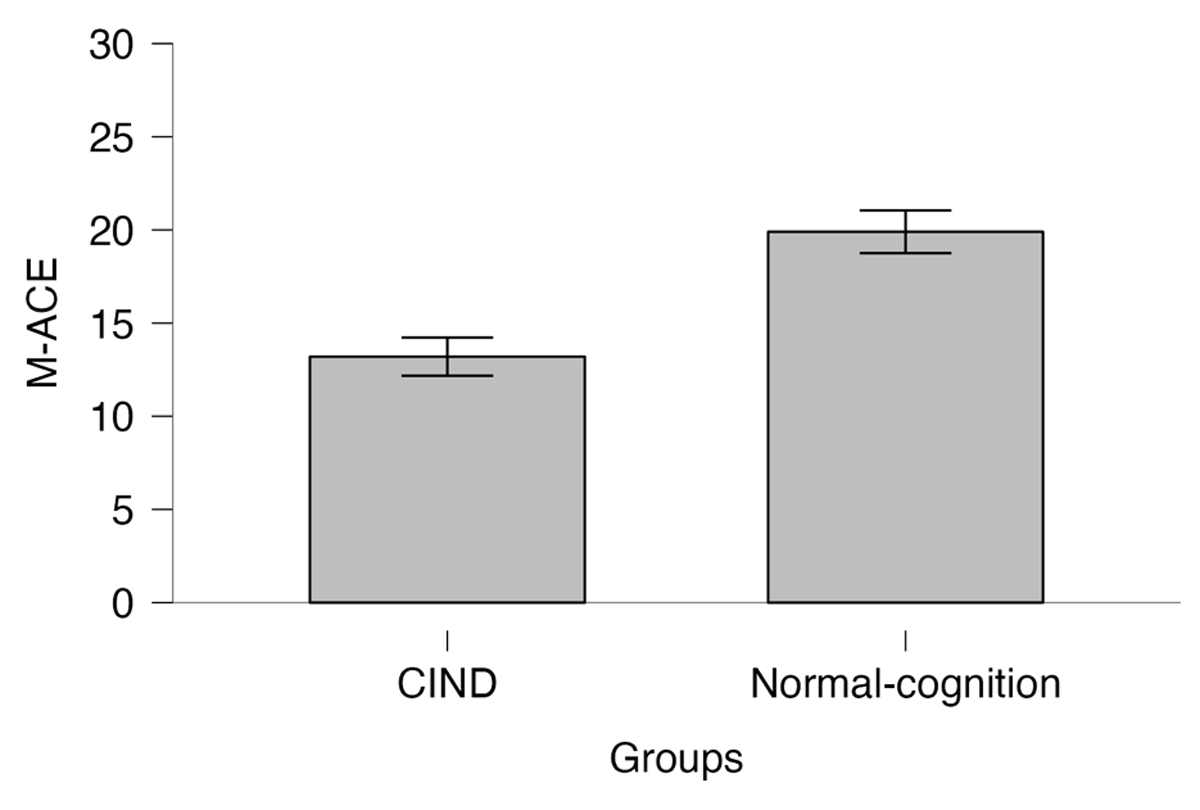
Figure 3
Bar plot of M-ACE Mean Scores in CIND and Normal-cognition Groups with 95%CI.
Note: M-Addenbrooke Cognitive Examination; CIND = cognitive impairment no-dementia.