
Table 1
Details of Each of the Four Replications.
| TEAM | PARTICIPANTS | PARTICIPANTS (INOCULATION) | PARTICIPANTS(CONTROL) | SCALE | INDIVIDUAL DIFFERENCE MEASURE(S) |
|---|---|---|---|---|---|
| Bad News Bears | 90 | 46 | 44 | 7-point | Hours/day on social media |
| Bikes | 88 | 45 | 43 | 7-point | Social Desirability |
| Fake News Dudes | 87 | 44 | 43 | 6-point | Social media use |
| pHackers | 88 | 45 | 43 | 6-point | Hours/day on social media; Academic Year |
| Total | 353 | 180 | 173 |
Table 2
Truth Rating Scales for True and False Tweets by Student Research Team.
| RESEARCH TEAM | SCALE PROMPT | SCALE | ||||||
|---|---|---|---|---|---|---|---|---|
| Bad News Bears | “How truthful do you find this post?” | Definitely untrue | Neutral/unsure | Definitely true | ||||
| 1 | 2 | 3 | 4 | 5 | 6 | 7 | ||
| Bikes | “How true or false is this post?” | Definitely false | Probably false | Maybe false | Neutral | Maybe true | Probably true | Definitely true |
| 1 | 2 | 3 | 4 | 5 | 6 | 7 | ||
| pHackers | “How accurate do you find this post?” | Not at all | Neutral | Very | ||||
| 1 | 2 | 3 | 4 | 5 | ||||
| Fake News Dudes | “How truthful do you find this tweet?” | Definitely false | Mostly false | Slightly false | Slightly true | Mostly true | Definitely true | |
| 1 | 2 | 3 | 4 | 5 | 6 | |||
| “How reliable do you find this tweet?” | Definitely unreliable | Mostly unreliable | Slightly unreliable | Slightly reliable | Mostly unreliable | Definitely reliable | ||
| 1 | 2 | 3 | 4 | 5 | 6 | |||
Table 3
Basol et al.’s Reliability and Confidence Rating Scales for True and False Tweets.
| BASOL ET AL. | SCALE PROMPT | SCALE | ||||||
|---|---|---|---|---|---|---|---|---|
| “How reliable do you find this post?” | Not at all | Neutral | Very | |||||
| 1 | 2 | 3 | 4 | 5 | 6 | 7 | ||
| “How confident are you in your judgement?” | Not at all | Neutral | Very | |||||
| 1 | 2 | 3 | 4 | 5 | 6 | 7 | ||
Table 4
ANOVA Results Tables for Each Team.
| TEAM | EFFECT | F | p | n2p |
|---|---|---|---|---|
| Bad News Bears | True/False | 93.22 | <.001 | .514 |
| (df 1, 88 for all) | True/False × Condition | <1.00 | .647 | .002 |
| Pre/Post | 38.74 | <.001 | .306 | |
| Pre/Post × Condition | 15.02 | <.001 | .146 | |
| True/False × Pre/Post | <1.00 | .529 | .005 | |
| True/False × Pre/Post × Condition | <1.00 | .605 | .003 | |
| Condition | 1.09 | .300 | .012 | |
| Fake News Dudes | True/False | 379.31 | <.001 | .817 |
| (df 1, 85 for all) | True/False × Condition | 2.82 | .097 | .032 |
| Pre/Post | 46.41 | <.001 | .353 | |
| Pre/Post × Condition | 24.38 | <.001 | .223 | |
| True/False × Pre/Post | 2.19 | .143 | .025 | |
| True/False × Pre/Post × Condition | 2.79 | .098 | .032 | |
| Condition | 3.09 | .083 | .035 | |
| pHackers | True/False | 15.28 | <.001 | .151 |
| (df 1, 86 for all) | True/False × Condition | 1.58 | .212 | .018 |
| Pre/Post | 34.97 | <.001 | .289 | |
| Pre/Post × Condition | 8.53 | .004 | .090 | |
| True/False × Pre/Post | 3.48 | .065 | .039 | |
| True/False × Pre/Post × Condition | <1.00 | .513 | .005 | |
| Condition | 6.42 | .013 | .069 | |
| Team Bikes | True/False | 33.07 | <.001 | .278 |
| (df 1, 86 for all) | True/False × Condition | <1.00 | .657 | .002 |
| Pre/Post | 28.37 | <.001 | .248 | |
| Pre/Post × Condition | 19.10 | <.001 | .182 | |
| True/False × Pre/Post | 5.22 | .025 | .057 | |
| True/False × Pre/Post × Condition | 4.33 | .040 | .048 | |
| Condition | 8.04 | .006 | .086 |
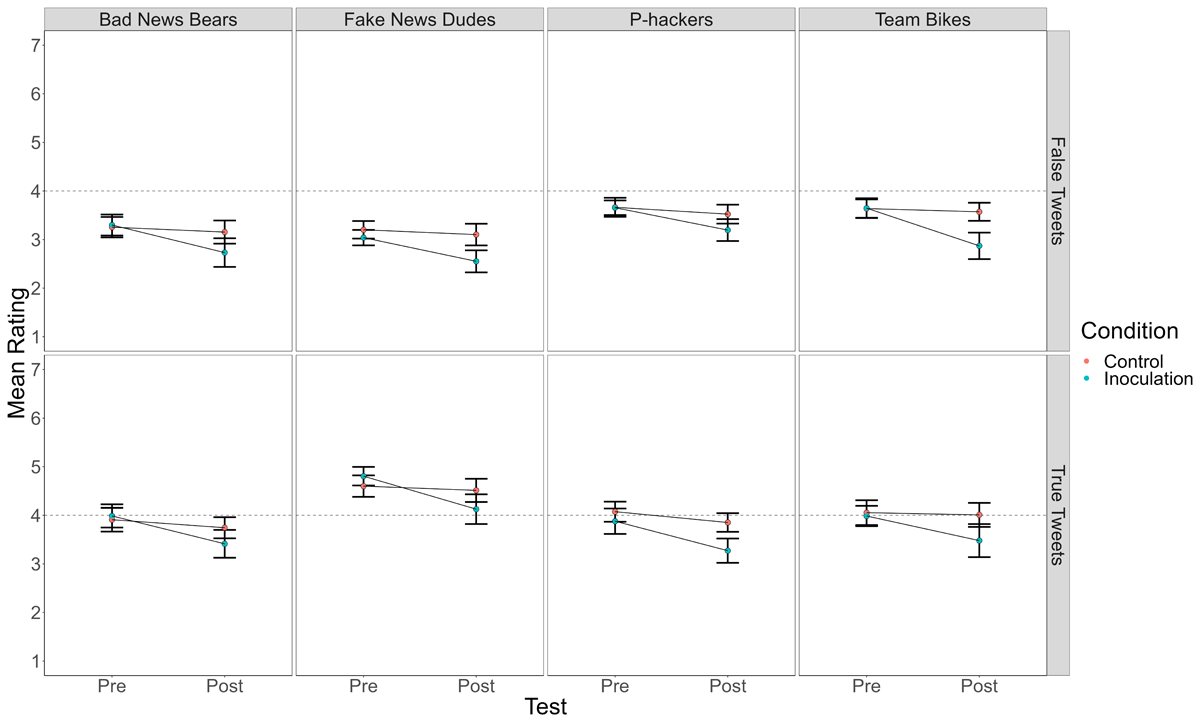
Figure 1
Mean Truth Ratings for True and False Tweets Before and After Playing the Bad News Game (Inoculation) or Tetris (Control) in Each of the Four Replication Attempts.
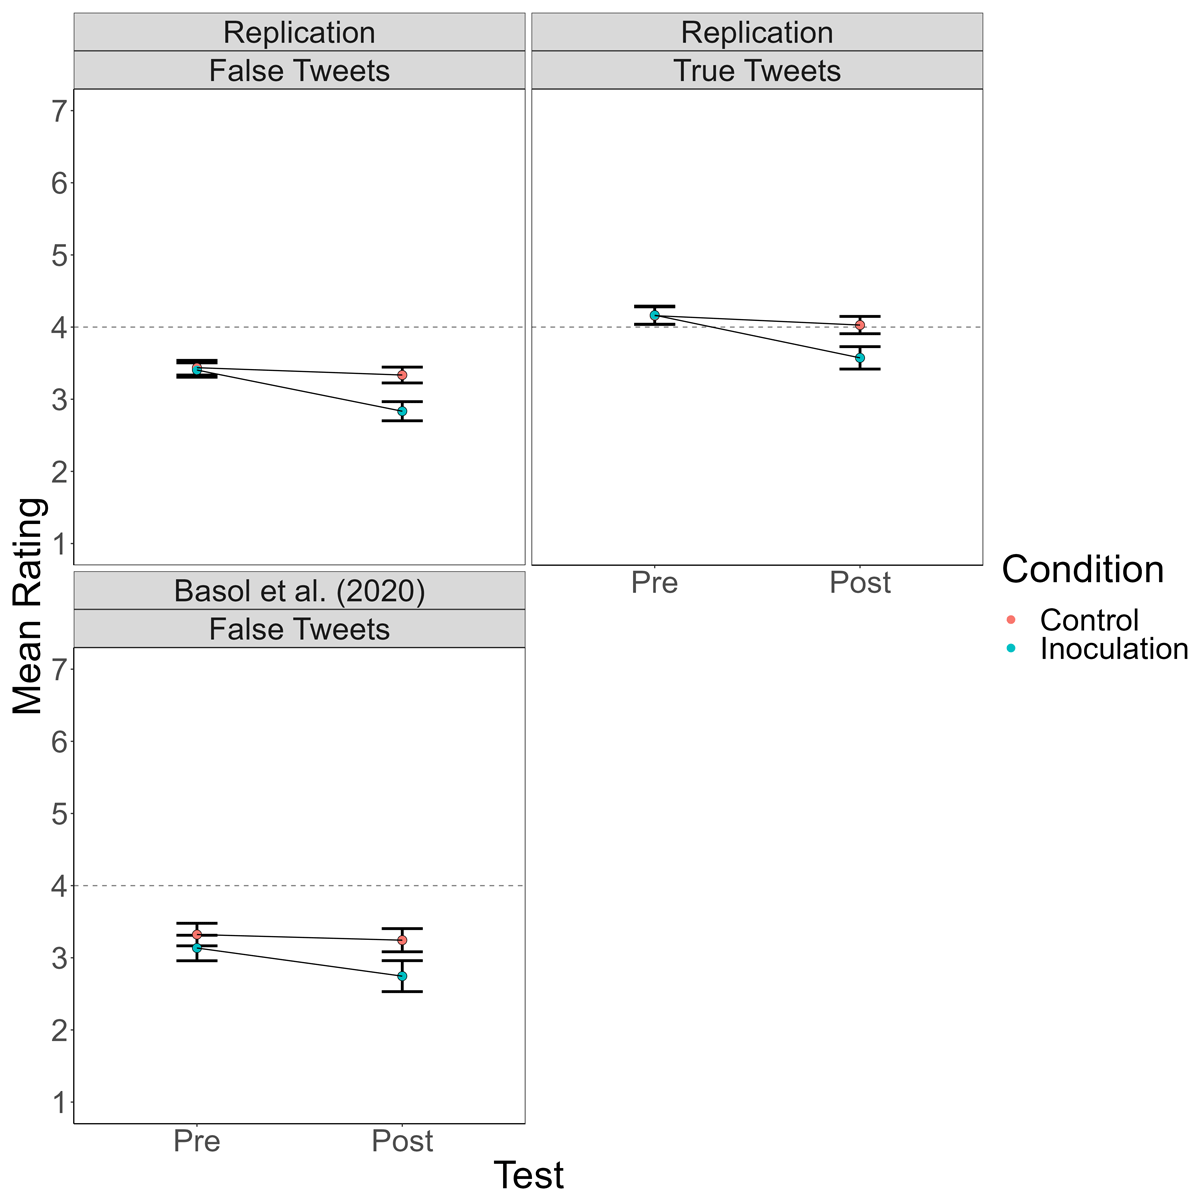
Figure 2
Mean Truth Ratings for True and False Tweets Before and After Playing the Bad News Game (Inoculation) or Tetris (Control) Across the Four Replications and for False Tweets in the Basol et al. (2020) Data.
Table 6
Effect Size Estimates (Cohen’s d) for the Difference Between Pre-test and Post-test Ratings (and the Associated 95% Confidence Interval) for True and False Tweets as a Function of Treatment Group.
| TEAM | VALUE OF COHEN’S d | |
|---|---|---|
| FALSE TWEETS | TRUE TWEETS | |
| Bad News Bears | 0.55 (CI 0.23) | 0.58 (CI 0.22) |
| Fake News Dudes | 0.62 (CI 0.23) | 0.56 (CI 0.23) |
| pHackers | 0.52 (CI 0.22) | 0.56 (CI 0.23) |
| Team Bike | 0.64 (CI 0.23) | 0.36 (CI 0.22) |
| All UVic Teams | 0.58 (CI 0.12) | 0.51 (CI 0.11) |
Table 7
Change in Truth Ratings on False Tweets from Pretest to Post-test as Function of Training Condition (BNG vs. Tetris).
| TEAM | t | df | p | COHEN’S d | 95% CI FOR COHEN’S d | |
|---|---|---|---|---|---|---|
| LOWER | UPPER | |||||
| Bad News Bears | 3.88* | 62.59 | <.001 | 0.81 | 1.25 | 0.37 |
| Fake News Dudes | 4.16 | 85.00 | <.001 | 0.89 | 1.33 | 0.45 |
| pHackers | 2.64* | 65.47 | .01 | 0.56 | 0.99 | 0.13 |
| Team Bikes | 5.79* | 72.96 | <.001 | 1.23 | 1.69 | 0.76 |
[i] *Welch test reported due to heterogeneity of variance.
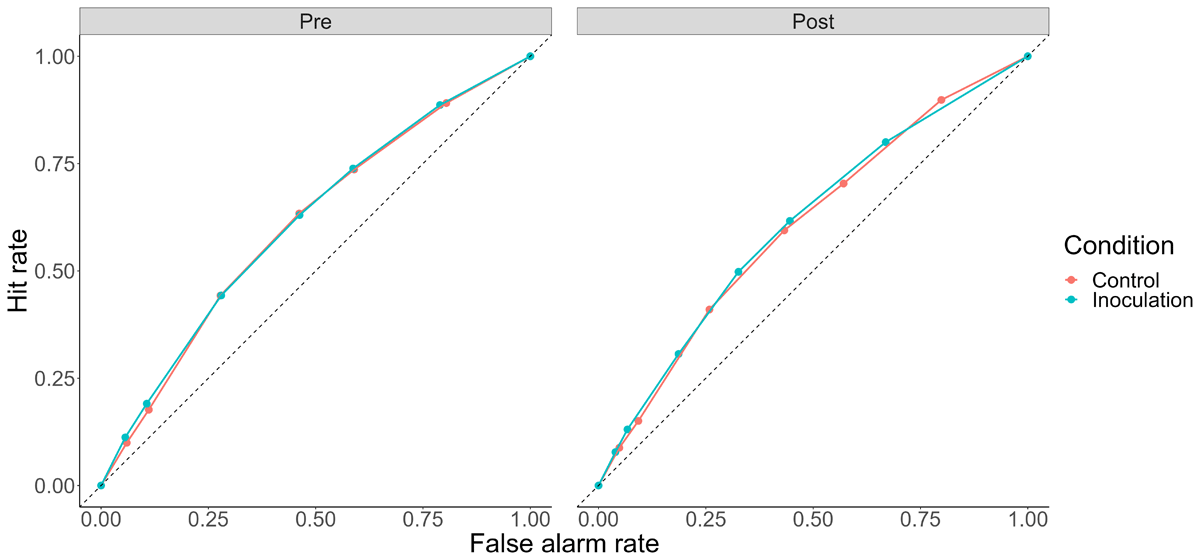
Figure 3
ROC Curves by Condition and Pre/Post.
Note: Dashed line represents chance sensitivity, with curves bowing further from the dashed line representing higher sensitivity.
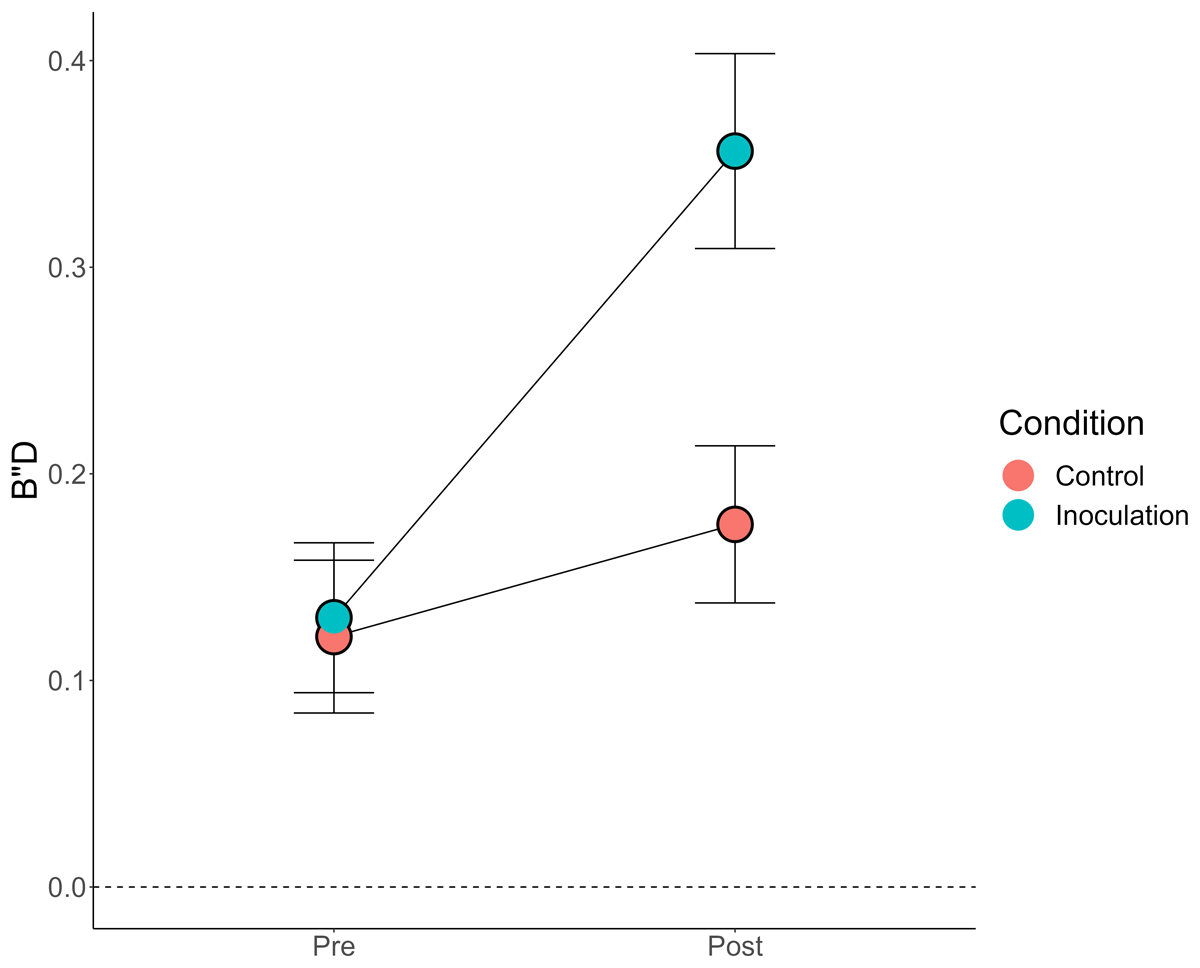
Figure 4
Response Bias (B”D) by Condition and Pre/Post.
Note: Error bars = 95% CIs (between-subjects). Dashed line at 0 B”D indicates “neutral” response bias.
Table 5
Results of a Mixed Model Omnibus Analysis of Variance of Ratings, with True/False Tweets and Pre/Post Ratings as Repeated Measures and Condition and Team as Between-Subjects Factors.
| WITHIN SUBJECTS EFFECTS | |||
|---|---|---|---|
| EFFECT | DF | F | P |
| TrueFalse | 1 | 388.55 | <.001 |
| TrueFalse ✻ Condition | 1 | 0.53 | .467 |
| TrueFalse ✻ team | 3 | 56.75 | <.001 |
| TrueFalse ✻ Condition ✻ Team | 3 | 1.50 | .214 |
| Residuals | 345 | ||
| PrePost | 1 | 142.59 | <.001 |
| PrePost ✻ Condition | 1 | 63.03 | <.001 |
| PrePost ✻ Team | 3 | 0.03 | .994 |
| PrePost ✻ Condition ✻ Team | 3 | 0.70 | .554 |
| Residuals | 345 | ||
| TrueFalse ✻ PrePost | 1 | 0.81 | .368 |
| TrueFalse ✻ PrePost ✻ Condition | 1 | 0.01 | .928 |
| TrueFalse ✻ PrePost ✻ Team | 3 | 3.68 | <.05 |
| TrueFalse ✻ PrePost ✻ Condition ✻ Team | 3 | 2.57 | .054 |
| Residuals | 345 | ||
| BETWEEN SUBJECTS EFFECTS | |||
| EFFECTS | DF | F | P |
| Condition | d | 15.67 | <.001 |
| Team | 3 | 3.76 | .011 |
| Condition ✻ Team | 3 | 0.50 | .681 |
| Residuals | 345 | ||
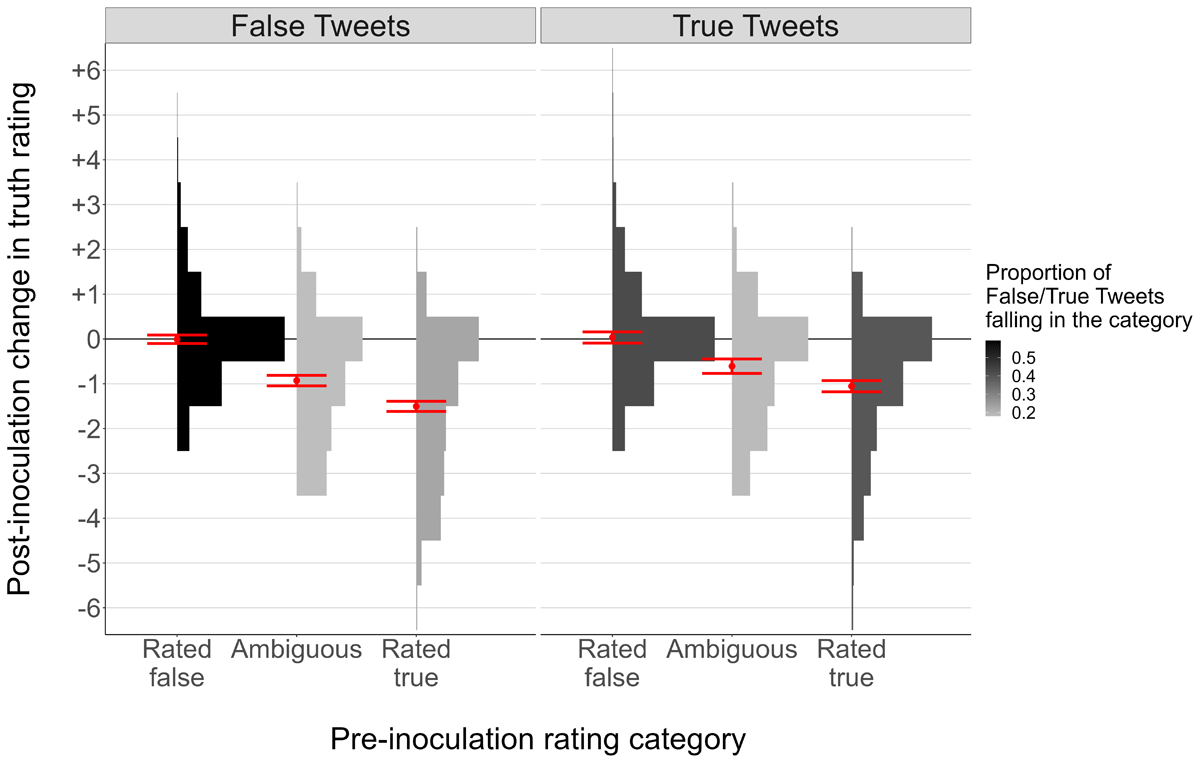
Figure 5
Change in Truth Ratings as a Function of Tweet Ground Truth and Initial Truth Ratings.
Note: Red points = model-predicted means, red error bars = model-predicted 95% CIs, histograms = relative frequency of each post-inoculation effect in each pre-inoculation rating category.