
Table 1
Overview of experiments.
| EXPERIMENT | SERIAL-ORDER MEMORY TASK | OTHER TASK | LENGTH OF MINI-BLOCKS | INTER-ITEM INTERVAL (S) | BF10 IN FAVOR OF PI IN SERIAL-ORDER MEMORY |
|---|---|---|---|---|---|
| 1a | Serial Recall | Object-Word Pairs | 4 | 1 | 0.07 |
| 1b | Serial Recall | Object-Word Pairs | 4 | 1 | 2.2 |
| 2a | Probed Recall | Object-Word Pairs | 4 | 1 | 28.7 |
| 2b | Probed Recall | Object-Word Pairs | 8 | 1 | 0.04 |
| 3 | Serial Recall | Spatial location reproduction | 4 | 1 | 0.06 |
| 4 | Probed Recall | Color reproduction | 4 | 1 | 0.17 |
| 5 | Probed Recall | Color reproduction | 4 | 5 | 0.06 |
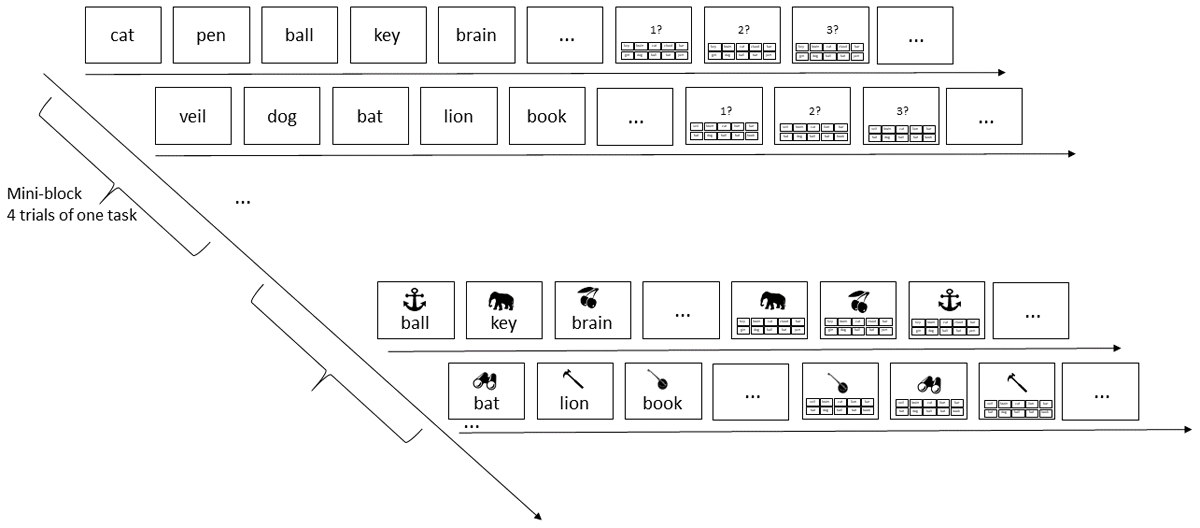
Figure 1
Illustration of the serial-recall task (top) and the pairs task (bottom). Each row shows the beginning of list presentation, and the beginning of the test phase, of one trial. Each mini-block consisted of four trials of the same task, followed by a mini-block with four trials of the other task.
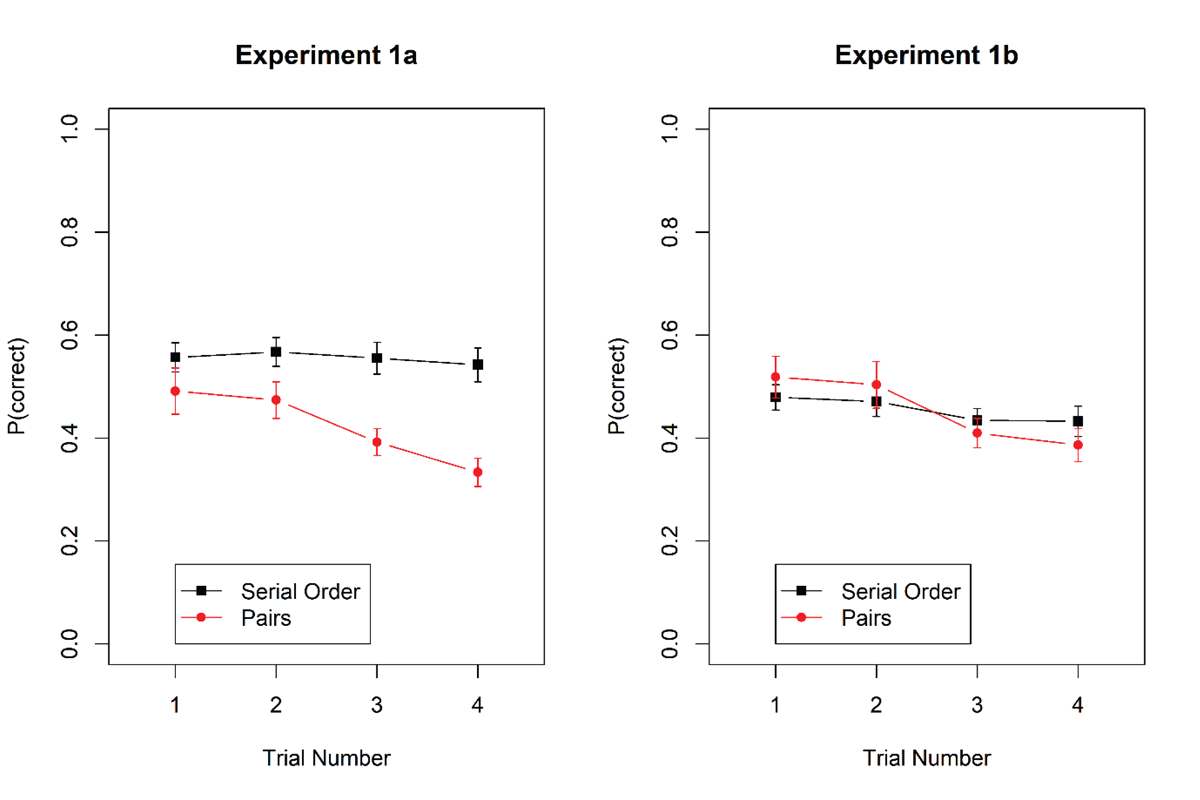
Figure 2
Proportion of correct responses in the serial-recall and the pairs task in Experiments 1a and 1b. Error bars are 95% confidence intervals for within-subjects’ comparisons (Bakeman & McArthur, 1996).
Table 2
Bayes factors (BF10) in favor of fixed effects in Experiments 1a and 1b.
| EFFECT | EXPERIMENT 1A | EXPERIMENT 1B |
|---|---|---|
| 3-way interaction | 0.05 | 0.15 |
| Trial × Task | 1.51 × 10¹² | 1382 |
| Trial × Serial Position | 0.04 | 0.04 |
| Task × Serial Position | 1.68 × 1095 | 9.93 × 1087 |
| Trial | 3633 | 57907 |
| Task | 1706 | 0.10 |
| Serial Position | 1.33 × 10¹⁰ | 8.13 × 10¹⁰ |
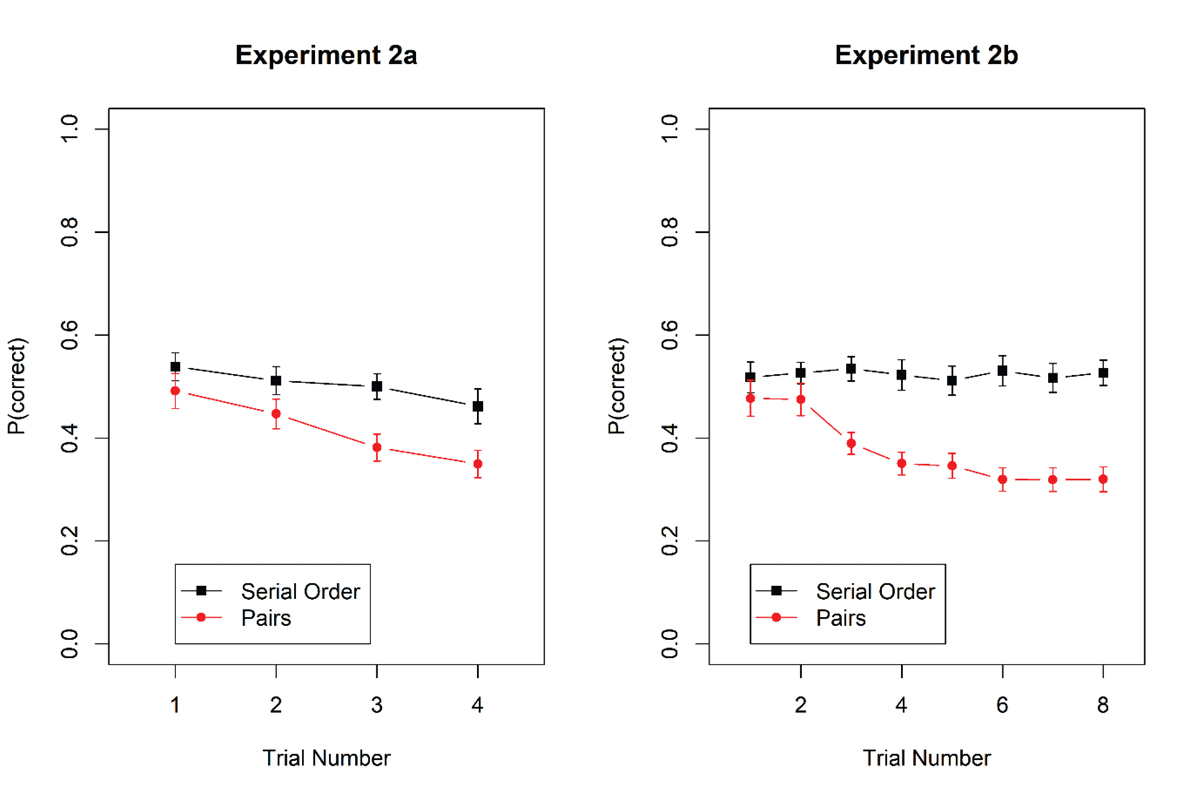
Figure 3
Accuracy in probed recall and pairs task as a function of trial within a mini-block in Experiments 2a and 2b. Error bars are 95% confidence intervals for within-subjects’ comparisons (Bakeman & McArthur, 1996).
Table 3
Bayes factors (BF10) in favor of fixed effects in Experiments 2a and 2b.
| EFFECT | EXPERIMENT 2A | EXPERIMENT 2B |
|---|---|---|
| 3-way interaction | 0.03 | 2.06 |
| Trial × Task | 0.19 | 7.94 × 10⁸ |
| Trial × Serial Position | 0.003 | 0.05 |
| Task × Serial Position | 0.2 | 391 |
| Trial | 5.00 × 10⁶ | 4.96 × 10⁵ |
| Task | 5064 | 2.92 × 10¹¹ |
| Serial Position | 2154 | 60 |
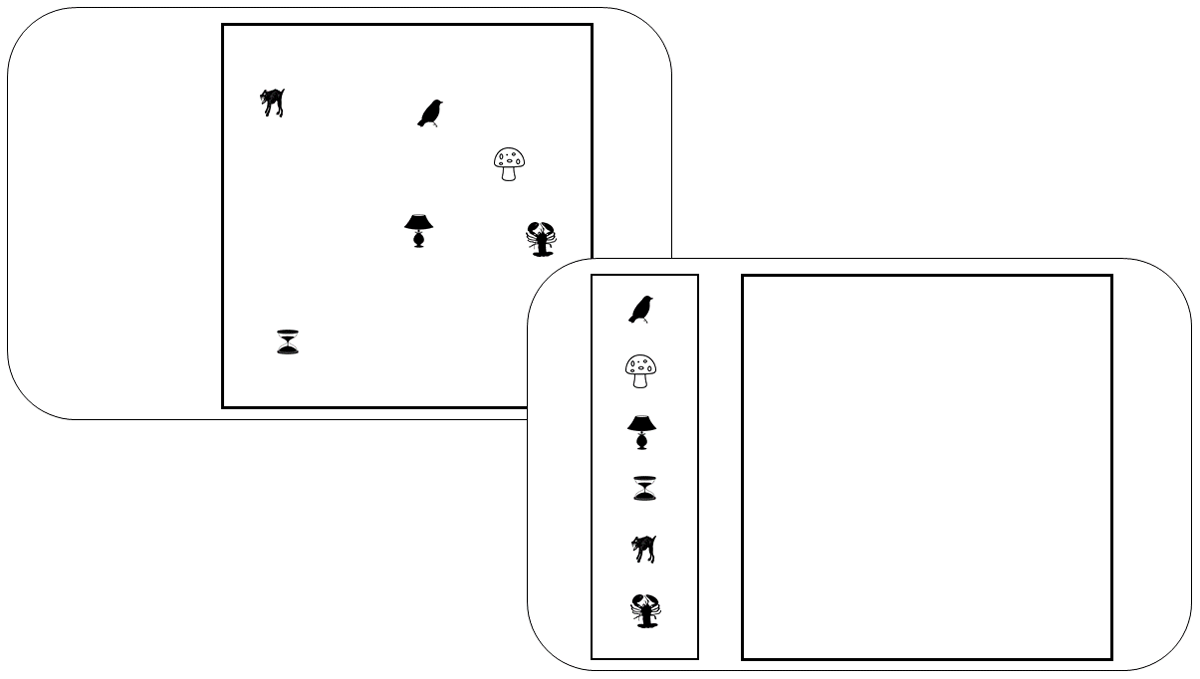
Figure 4
Illustration of the presentation screen (top left) and the test screen of the spatial reproduction task.
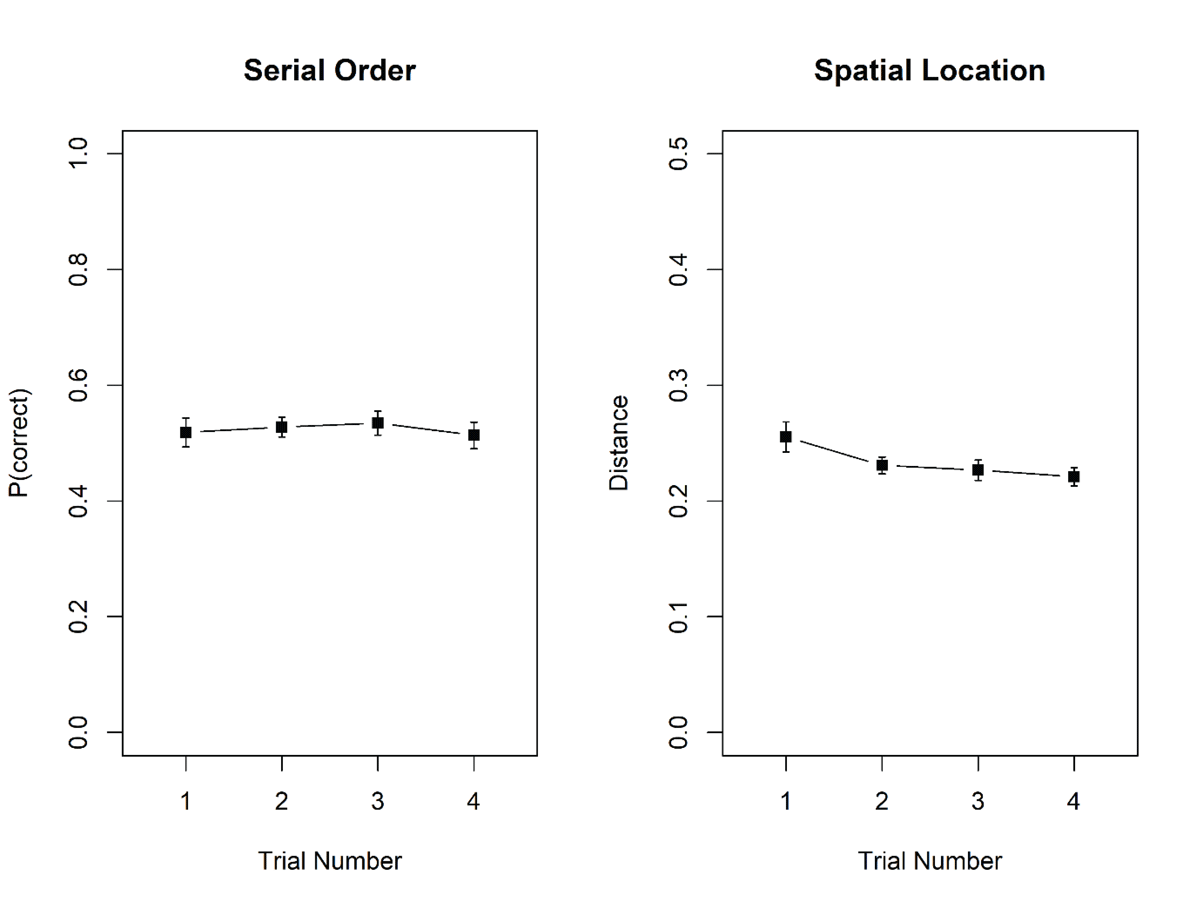
Figure 5
Proportion correct in the serial-recall task, and error of reproduction, measured as distance between the original and the reproduced location, in the spatial reproduction task, Experiment 3. Error bars are 95% confidence intervals for within-subjects comparisons (Bakeman & McArthur, 1996).
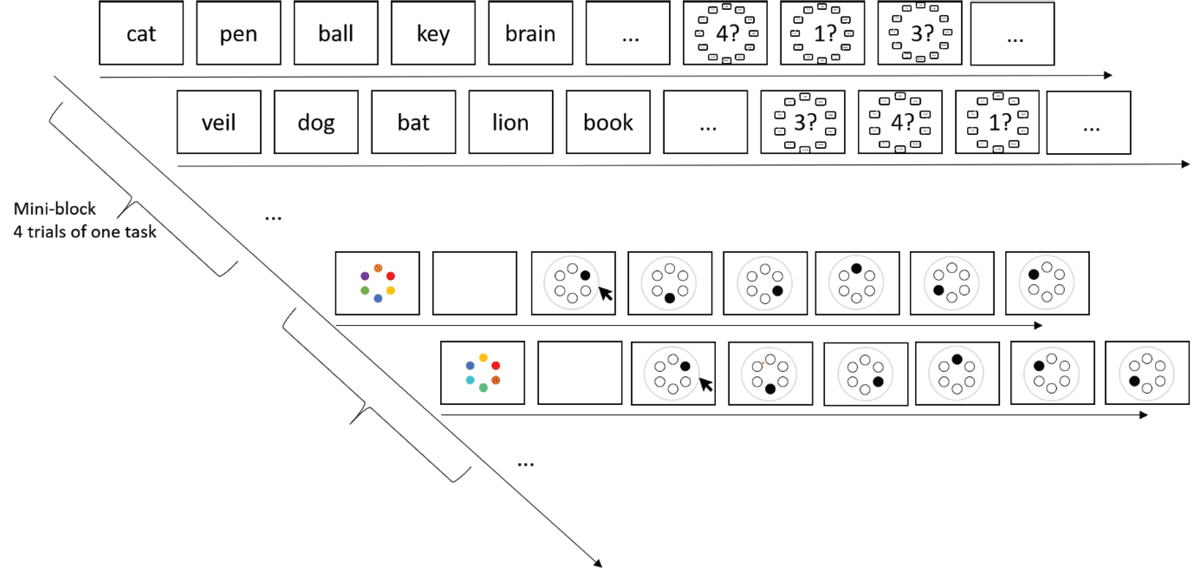
Figure 6
Task flow of the probed recall and color reproduction task of Experiment 4.
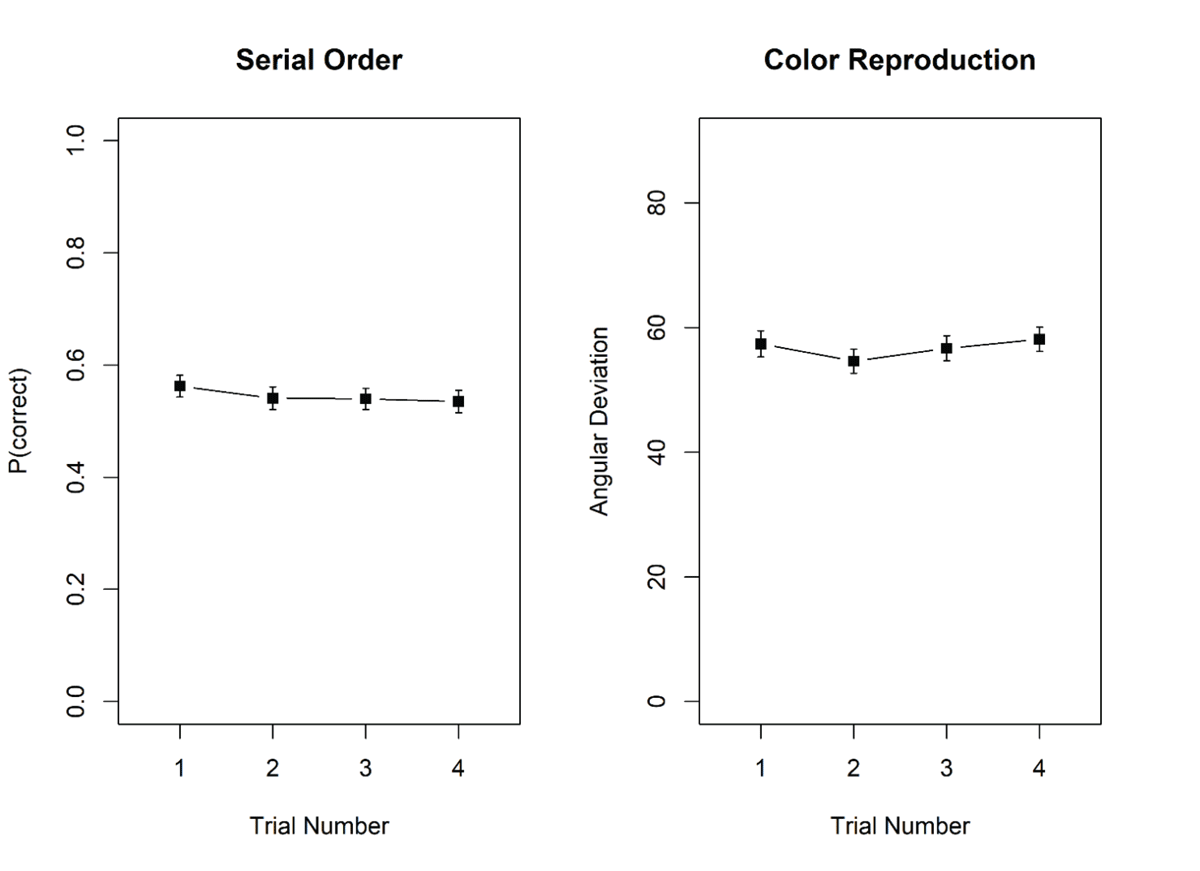
Figure 7
Proportion correct in the probed-recall task, and mean recall error, measured as angular distance between the original and the reproduced colour, in the colour reproduction task, Experiment 4. Error bars are 95% confidence intervals for within-subjects comparisons (Bakeman & McArthur, 1996).
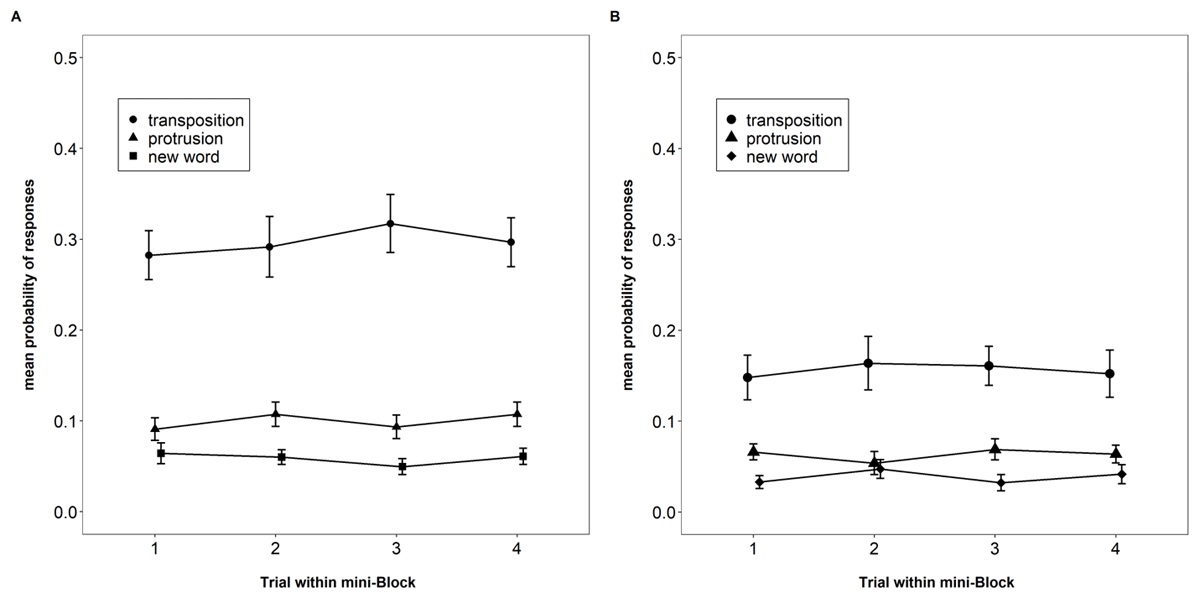
Figure 8
Proportion of each type of erroneous responses in the probed-recall task, Experiment 4 and 5 (Panel A and B, respectively). Error bars are 95% confidence intervals for within-subjects comparisons.
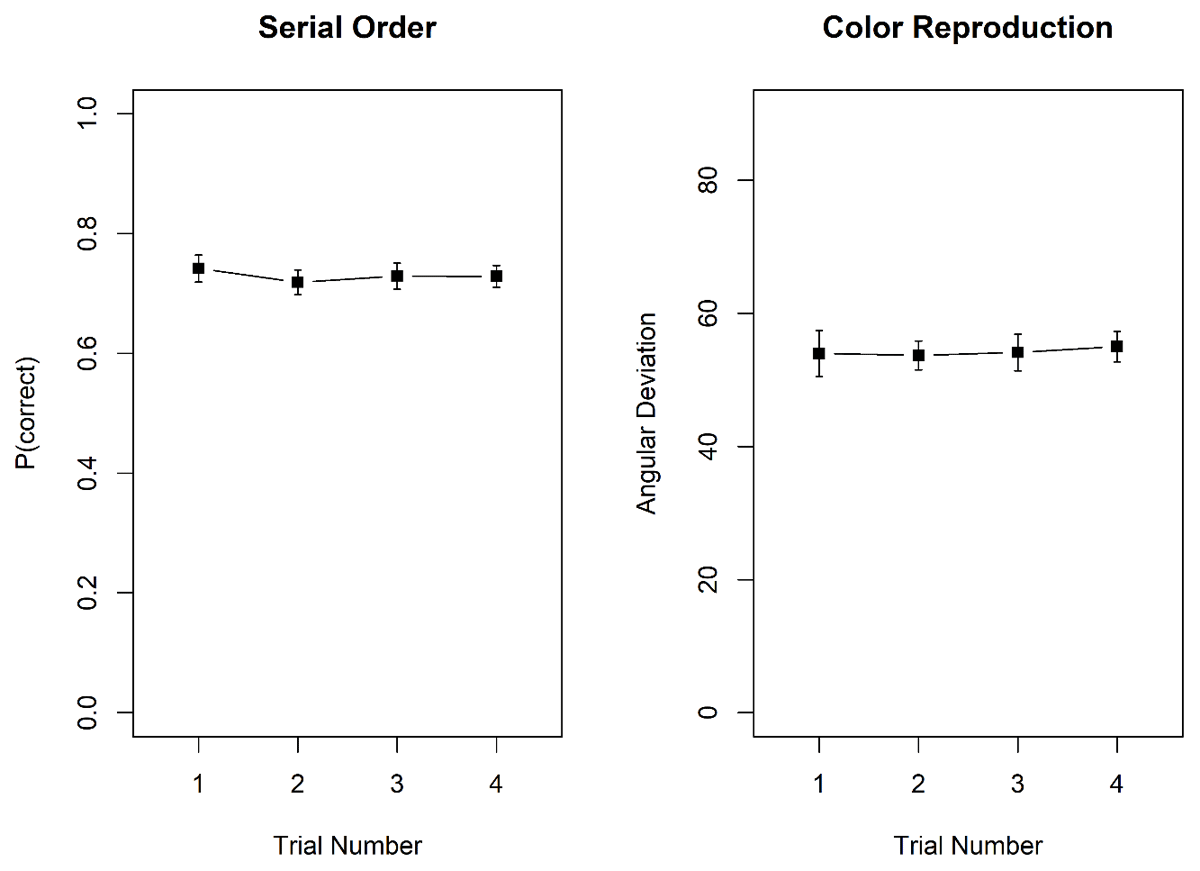
Figure 9
Proportion correct in the probed-recall task, and mean recall error, measured as angular distance between the original and the reproduced colour, in the colour reproduction task, Experiment 5. Error bars are 95% confidence intervals for within-subjects comparisons (Bakeman & McArthur, 1996).
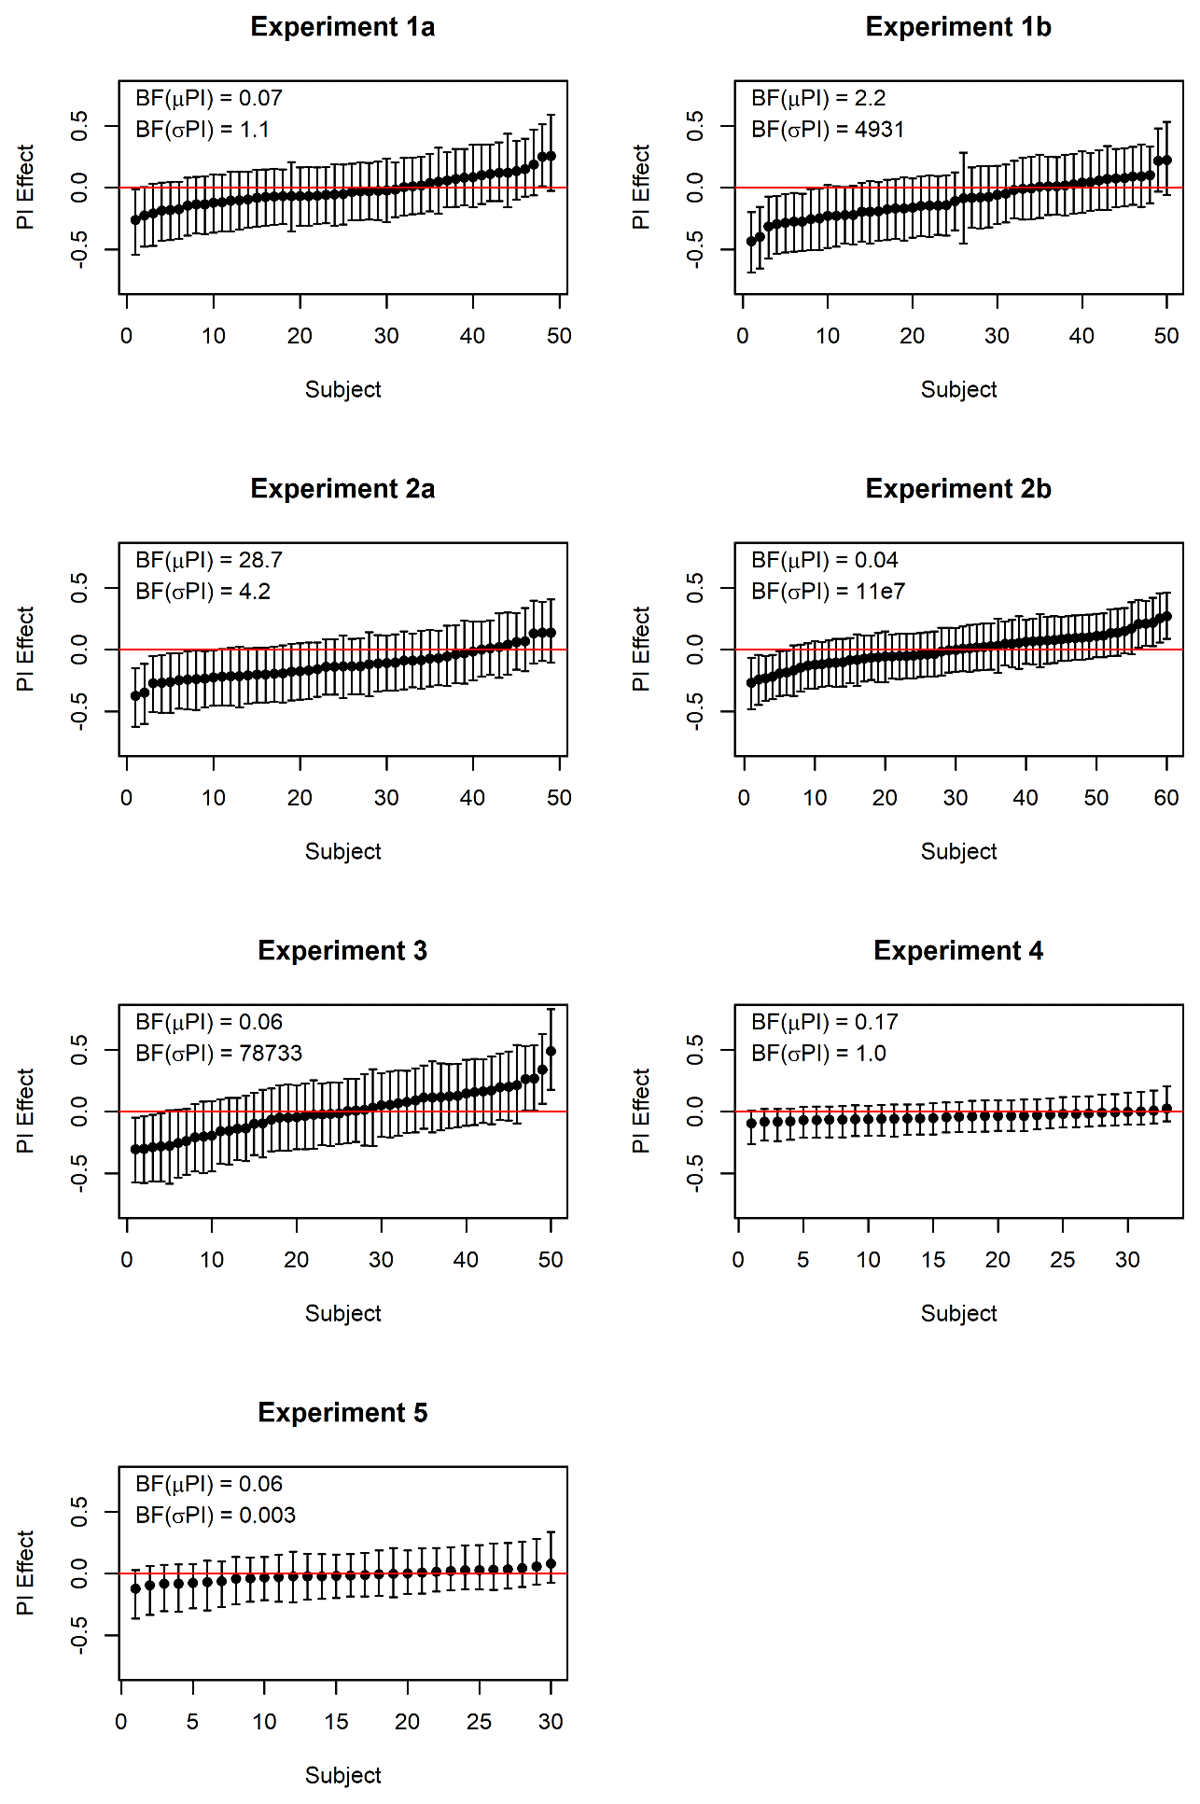
Figure 10
Posterior estimates of the effects of trial position within a mini-block for individual participants. Points represent the mean of the posterior, and error bars their 95% credible intervals. Negative effects reflect a decline of performance across trials in a mini-block, consistent with proactive interference. BF(μPI) is the Bayes factor in favor of including trial number as a fixed effect; BF(σPI) is the Bayes factor for including trial number as a random effect, that is, assuming individual differences in the effect.
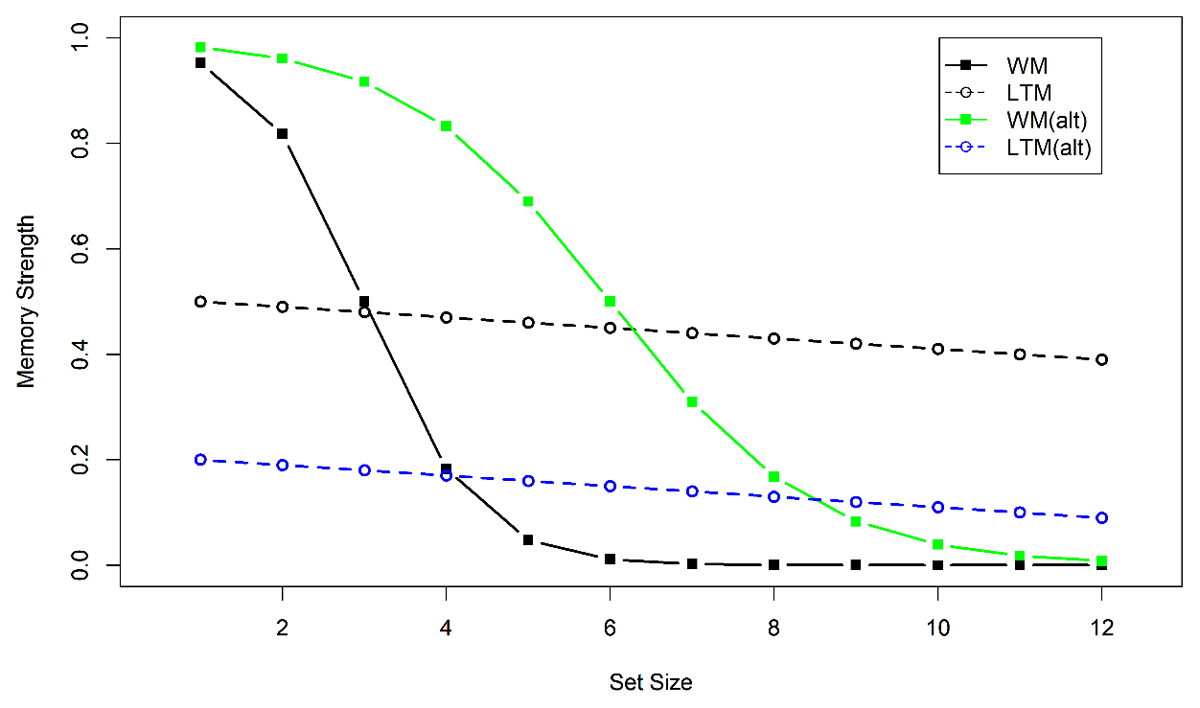
Figure 11
Schematic illustration of the flexible-gate hypothesis. Continuous lines show strength of WM representations, and broken lines the strength of eLTM representations. Black lines illustrate a task in which WM capacity imposes a severe constraint on memory strength, and episodic memory strength is high. An ideal gate-keeper would open the gate to eLTM when set size exceeds 3, because then relying on episodic memory leads to better performance than relying on WM. The green line shows an alternative scenario for a task where WM representations are less constrained by capacity. The blue line shows a scenario where episodic memory strength is poorer. Both alternative scenarios shift the point at which the gate should be opened to higher set sizes.