
Figure 1
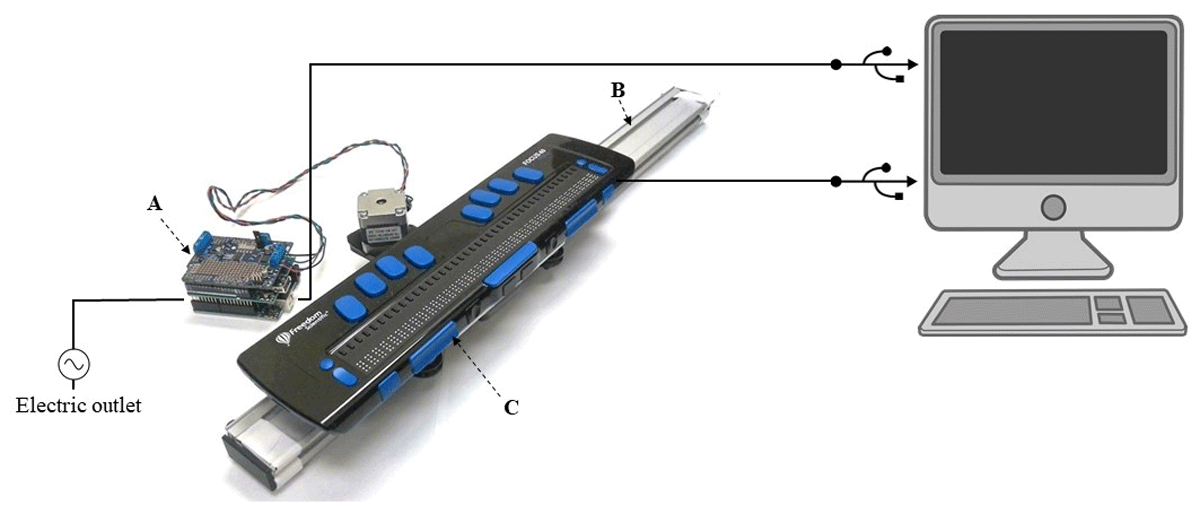
Figure 1 Diagram of the TouchScope tool and its connections. A) Arduino Uno board and Adafruit motor shield. B) Motorized linear bearing. C) Refreshable braille display.
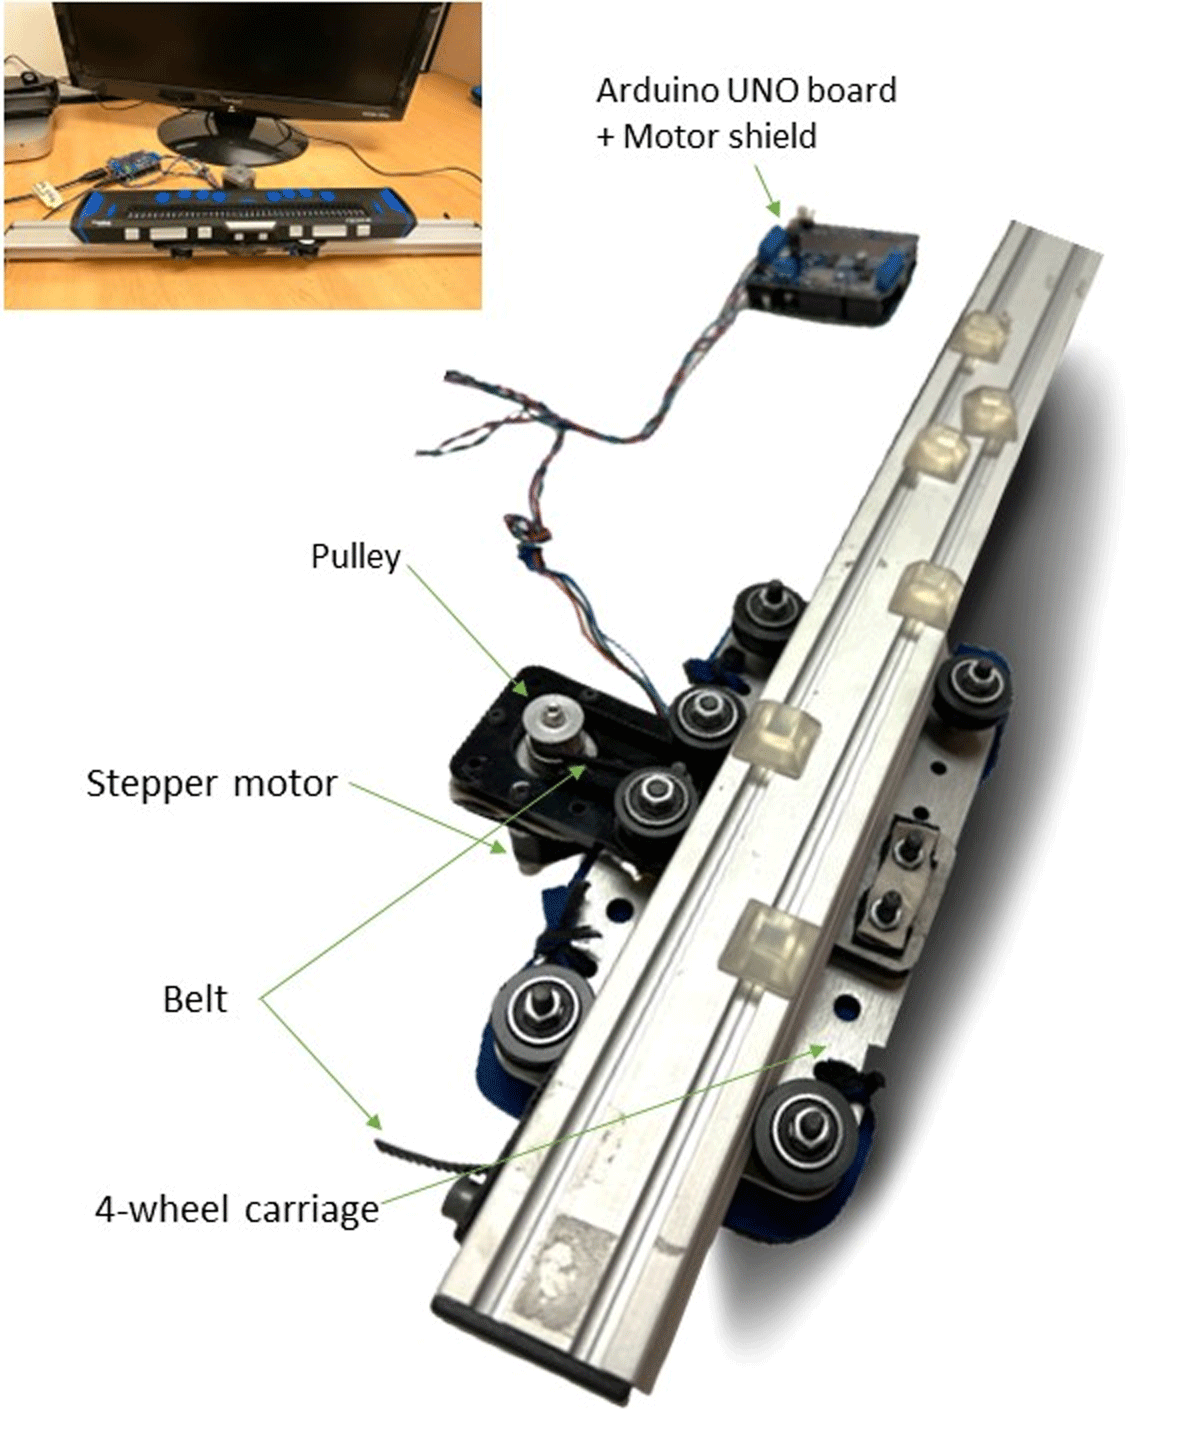
Figure 2
Main components of the motorized linear bearing. The main picture shows the linear bearing upside down while the picture in the top left corner shows the whole system in place (i.e., motorized linear bearing + refreshable braille display on top + circuit).
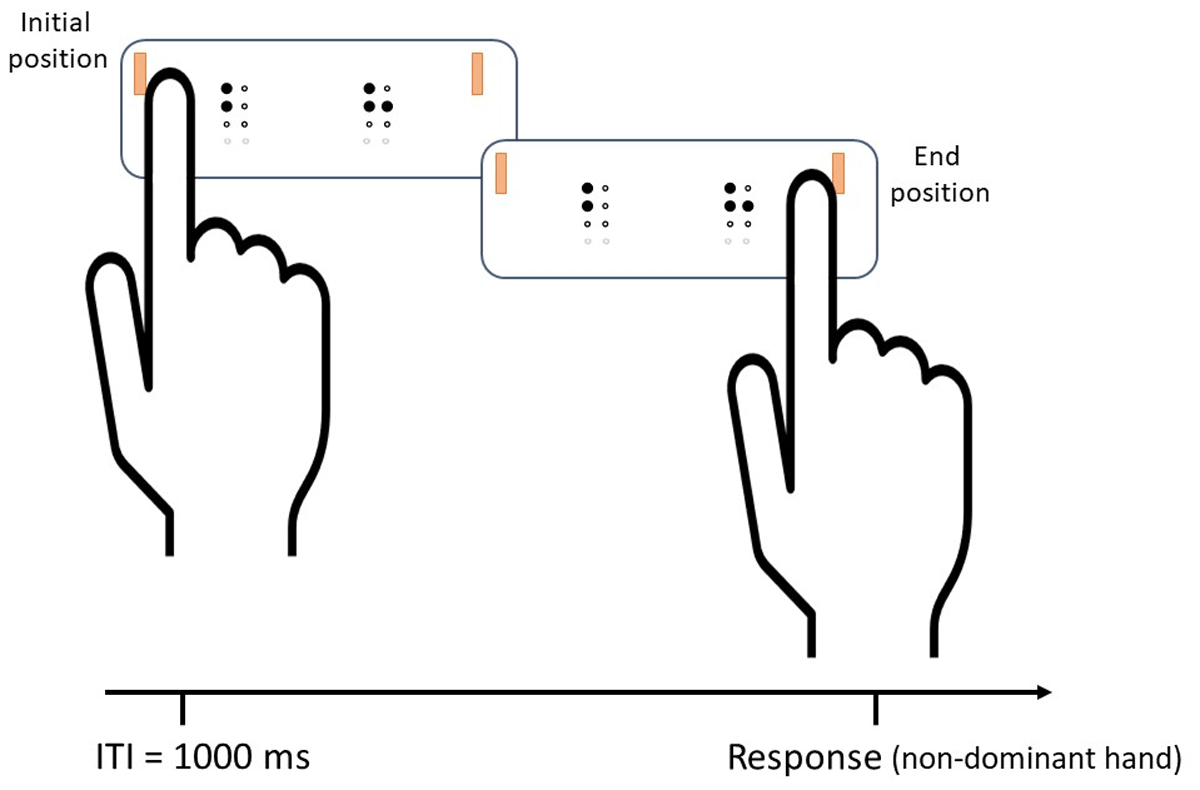
Figure 3
Diagram of a different trial in the same/different judgement task. Stimuli perception was done with the index finger of the dominant hand, and responses with the non-dominant hand. Inter-trial-interval (ITI) was one second—this allowed participants to reset the finger’s position. Every time a new trial appeared on display, the dots’ sound rising signaled participants to start the finger motion.
Table 1
Accuracy results from the linear mixed model.
| VARIABLE | b | SE | z | p |
|---|---|---|---|---|
| Accuracy | ||||
| Procedure (active vs. passive) | 0.065 | 0.069 | 0.940 | 0.347 |
| Trial type (same vs. different) | –0.143 | 0.070 | –2.057 | 0.040 |
| Interaction (procedure*trial type) | –0.289 | 0.044 | –6.531 | < 0.001 |
[i] Note: Overall, accuracy did not differ between the procedure groups. While accuracy was lower for different than for same trials, this difference was larger for the passive group than for the active group (14.0% vs. 8.1%, respectively).
Table 2
Latency results from the linear mixed model.
| VARIABLE | b | SE | t | p |
|---|---|---|---|---|
| Response time | ||||
| Procedure (active vs. passive) | 0.032 | 0.013 | –7.648 | < 0.001 |
| Trial type (same vs. different) | –0.03 | 0.03 | –1.141 | 0.254 |
| Interaction (procedure*trial type) | 0.01 | 0.02 | 0.772 | 0.440 |
[i] Note: Overall, response times were longer for the active group than for the passive group. The other effects were not significant.
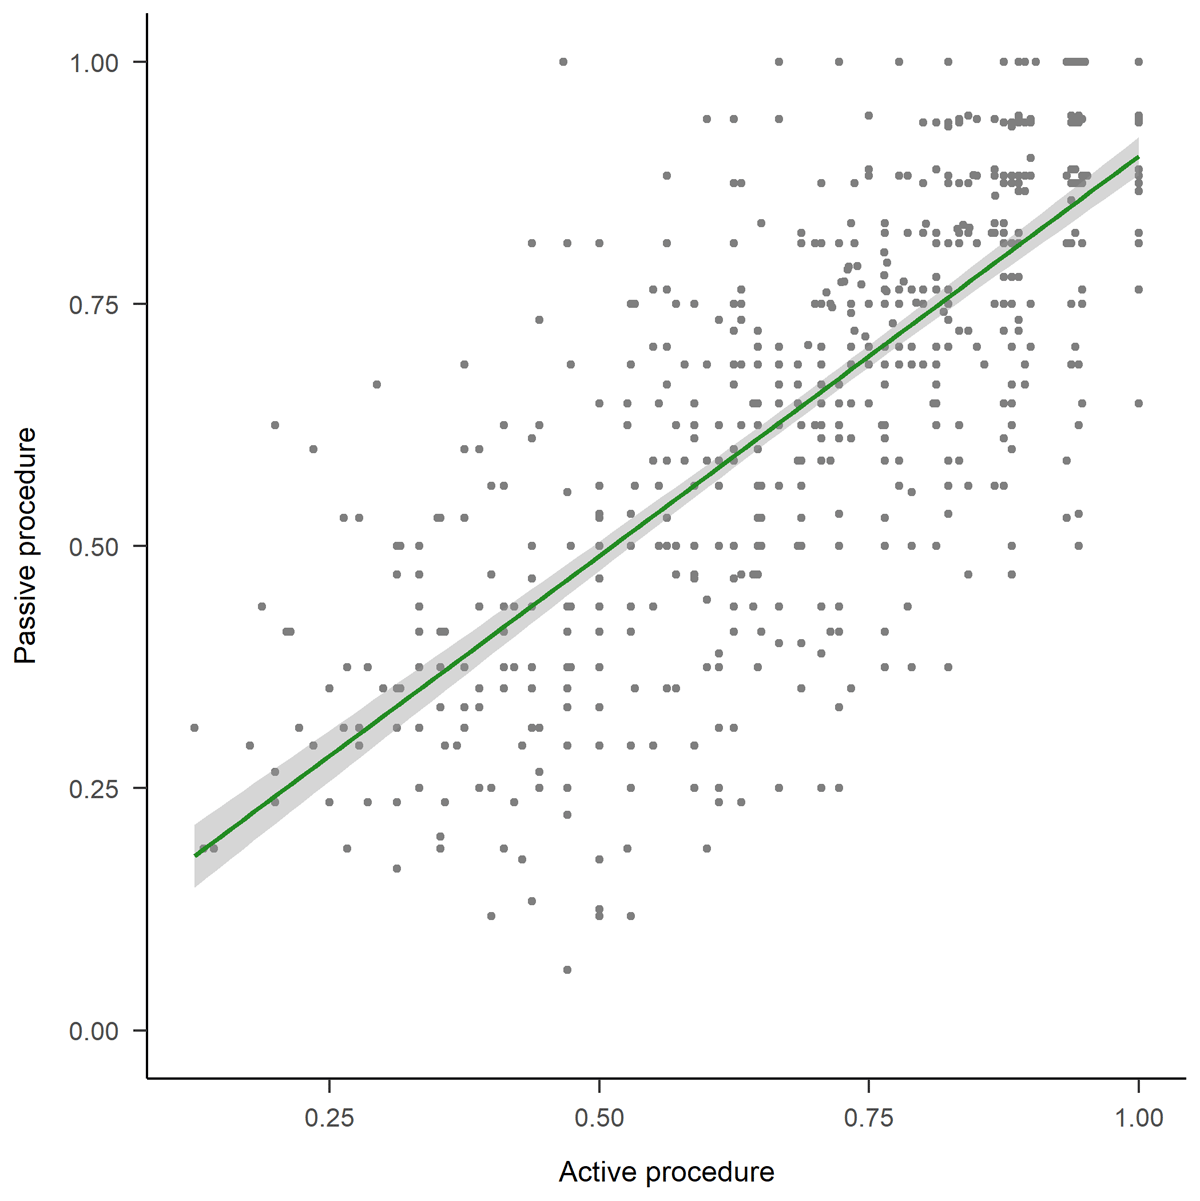
Figure 4
Scatterplot of the active and passive procedures. The x-axis shows the distribution of mean accuracy in the active condition and the y-axis shows the distribution of mean accuracy in the passive condition. Each data point represents a pair of letters, and the gray area represents the ±1 SE.