
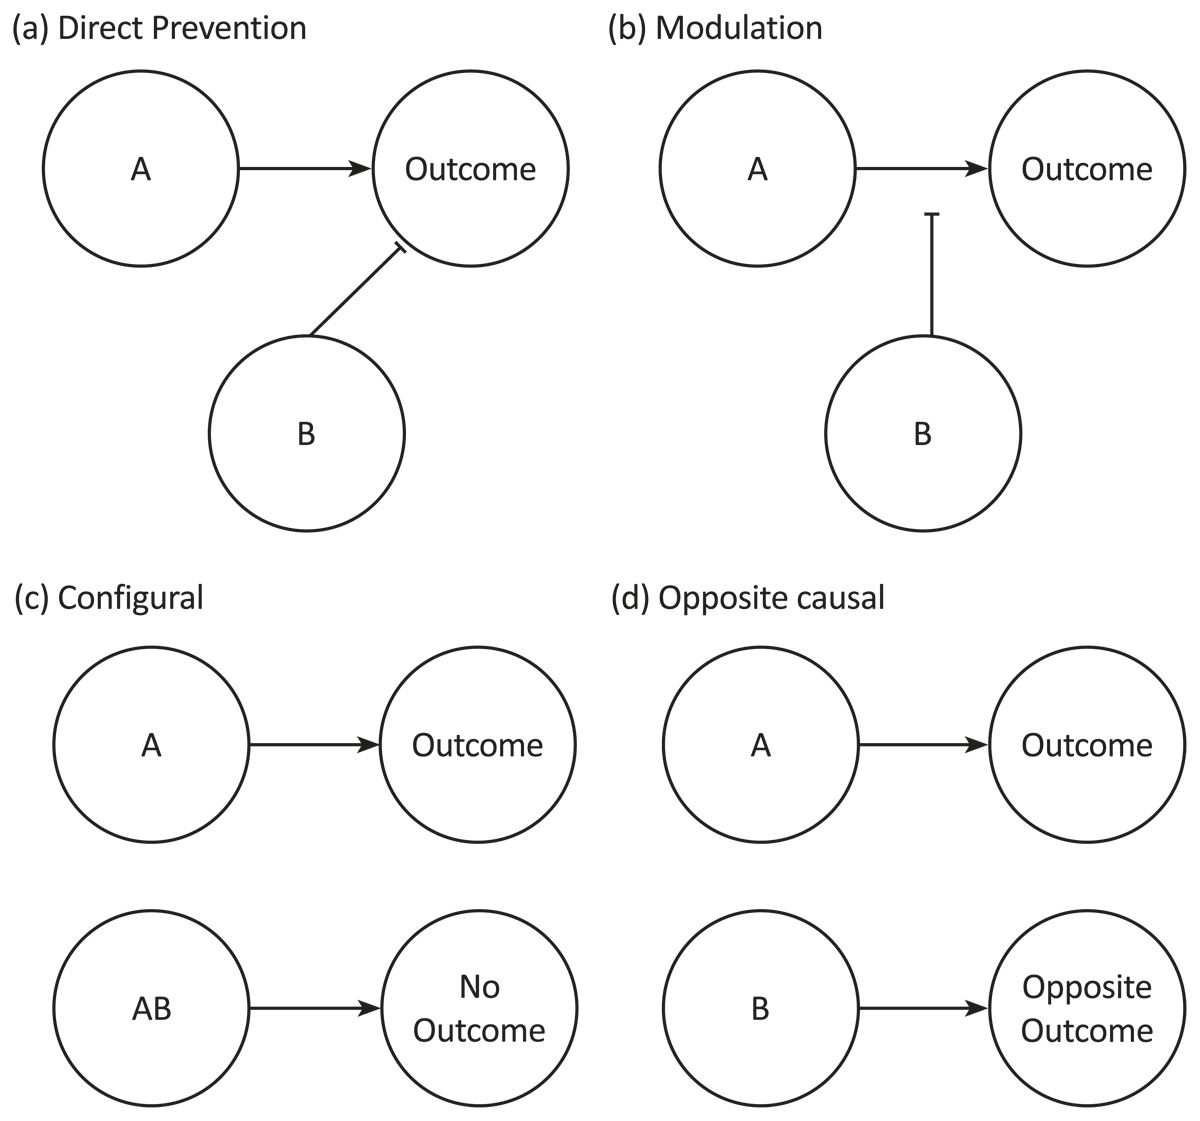
Figure 1
Diagrammatic Representation of All Four Causal Structures.
Note: Pointed arrowheads represent an excitatory connection, and flat arrowheads represent an inhibitory connection.
Table 1
Procedure of Experiment 1.
| TRAINING | TEST PREDICTIONS | CAUSAL RATINGS | OPEN-ENDED QUESTION | FORCED-CHOICE CAUSAL STRUCTURE ASSESSMENT |
|---|---|---|---|---|
| A+ AB0 | A AB B | A B | B | B |
| C+ | C CB CD CI | C | ||
| DE0 | DE D E | D E | ||
| F0 GH+ | F | F | ||
| I0/I– | I J | I J |
[i] Note: + = an increase in hormone level, 0 = no change, and – = a decrease.
Table 2
Number of participants in each group as a function of their 4-AFC selection.
| GROUP | CAUSAL STRUCTURE | NUMBER OF PARTICIPANTS |
|---|---|---|
| No Reference | Configural | 20 |
| Modulation | 23 | |
| Opposite Causal | 19 | |
| Prevention | 9 | |
| Reference | Configural | 28 |
| Modulation | 19 | |
| Opposite Causal | 9 | |
| Prevention | 14 |
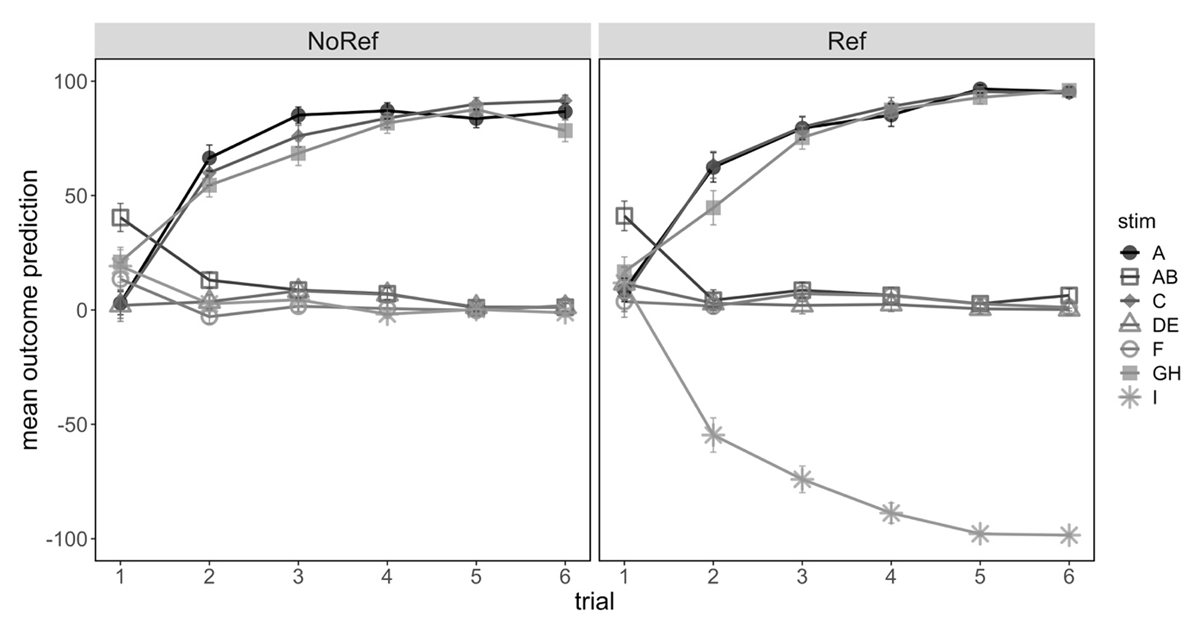
Figure 2
Mean Outcome Prediction (±SE) During Training For Participants In No Reference And Reference Group In Experiment 1.
Note: Filled symbols denote stimuli that predicted hormone level increase, and unfilled symbols denote stimuli that predicted no change (or hormone level decrease in the case of cue I in the Reference condition).
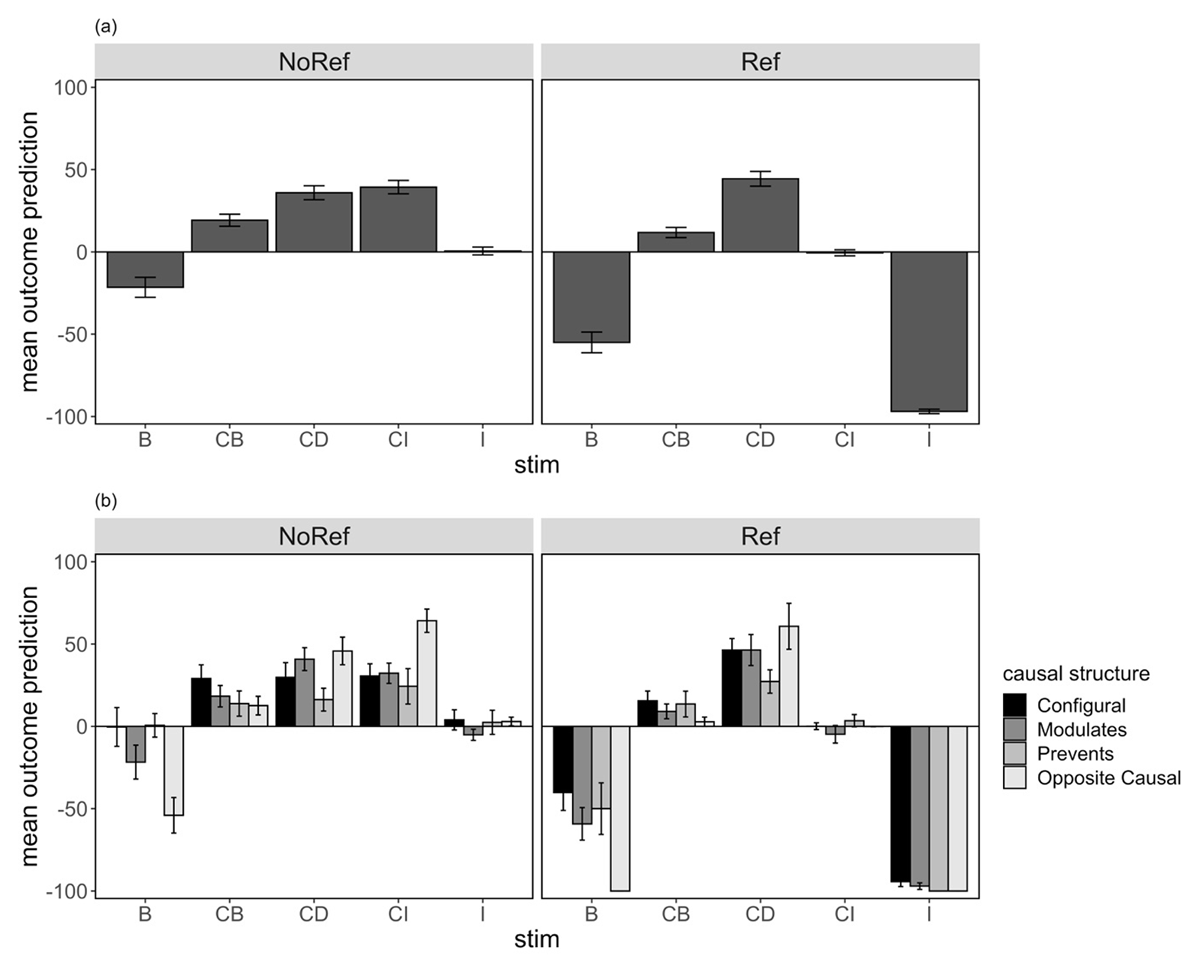
Figure 3
Average Outcome Prediction at Test (±SE) for Critical Summation Compounds (a) as a Group Average, and (b) Separated by Causal Structure Subgroup, for the No Reference and Reference Group Respectively in Experiment 1.
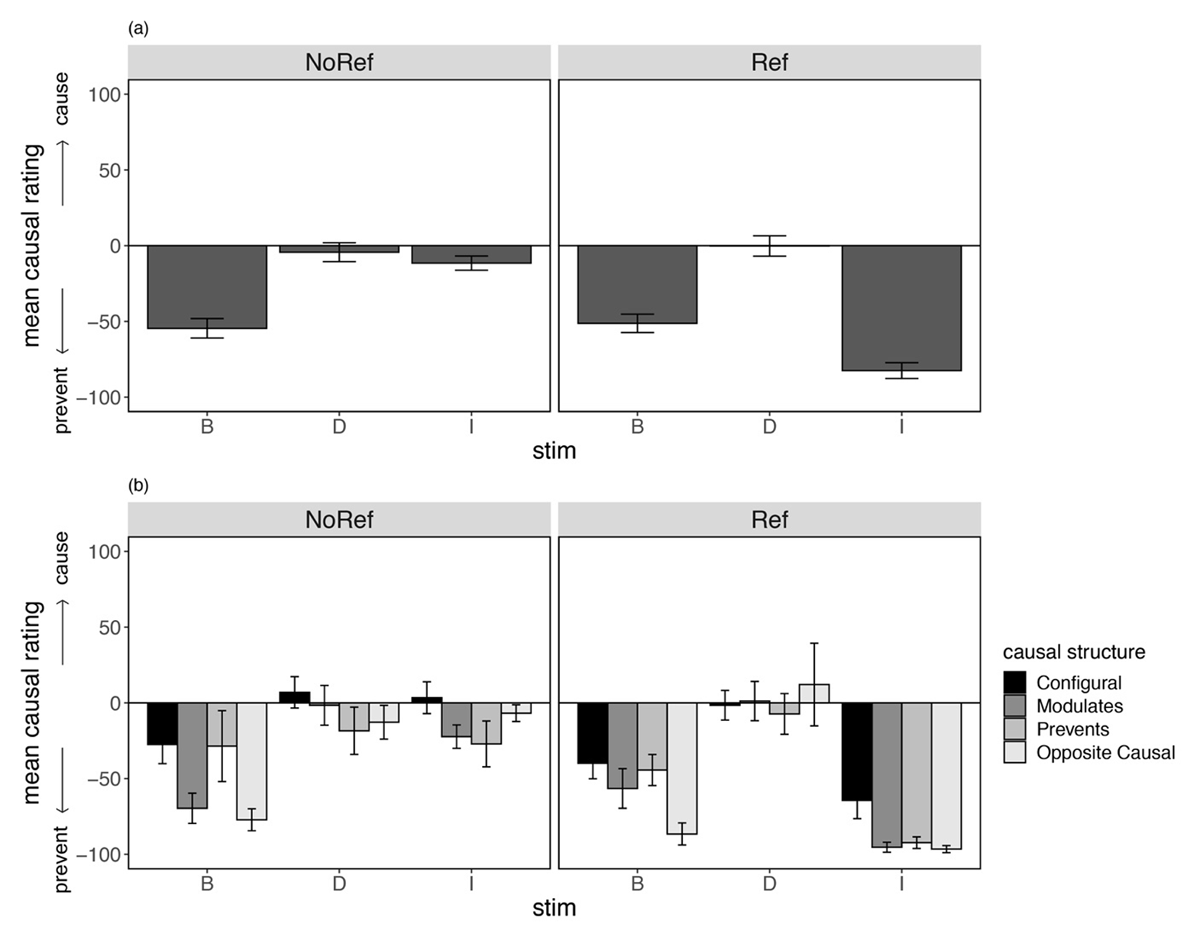
Figure 4
Mean Causal Ratings at Test (±SE) for Critical Stimuli Only for Participants in the No Reference and Reference Group as a (a) Group Mean, and (b) Separated By Causal Structure in Experiment 1.
Note: Causal ratings were made on cause-prevent scale, from –100 (Strongly prevented an increase) to +100 (Strongly caused an increase) with a midpoint of 0 (No effect).
Table 3
Design of Experiment 2.
| TRAINING | BLOCKING PHASE | TEST PREDICTIONS | CAUSAL RATINGS | FORCED-CHOICE CAUSAL STRUCTURE ASSESSMENT |
|---|---|---|---|---|
| A+20 AB0 | BX-20 | A B AB | A B | B |
| C-20 | DY-20 | C | C | |
| DE0 | DE D E | D E | ||
| F0 | F0 | |||
| G+20 H+20 | G+20 | G GH | G H | |
| GH+40 | GH+40 | I X Y | I X Y |
[i] Note: + = an increase in hormone level, 0 = no change, and – = a decrease. Numeric values indicate the magnitude of change. Column headings describe each phase of the experiment in sequence from left to right, beginning with the Training phase and ending with the Forced-choice causal structure assessment. All stimuli presented in each phase (and their associated outcomes) are denoted below the relevant column heading.
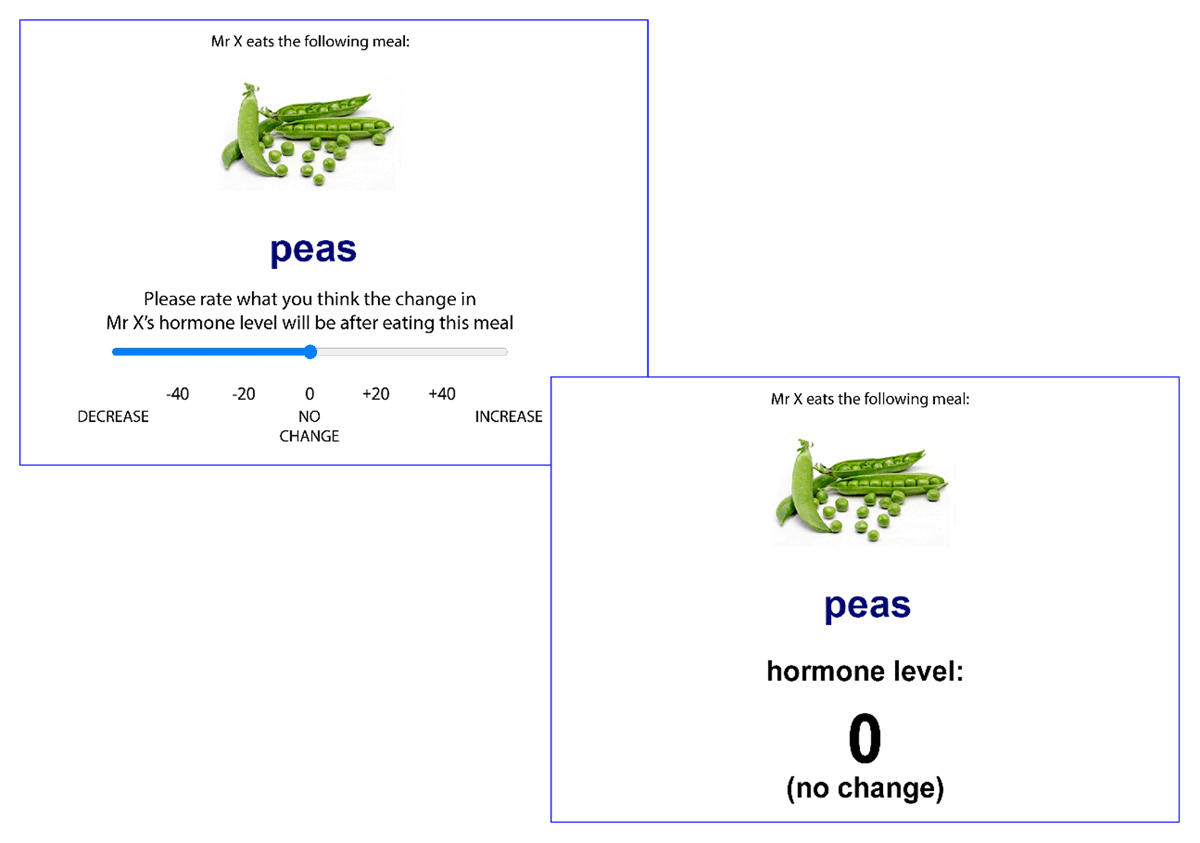
Figure 5
Example Screenshots from a Single Training Trial in Experiment 2, Where the Cue is Followed by No Change in Hormone Level.
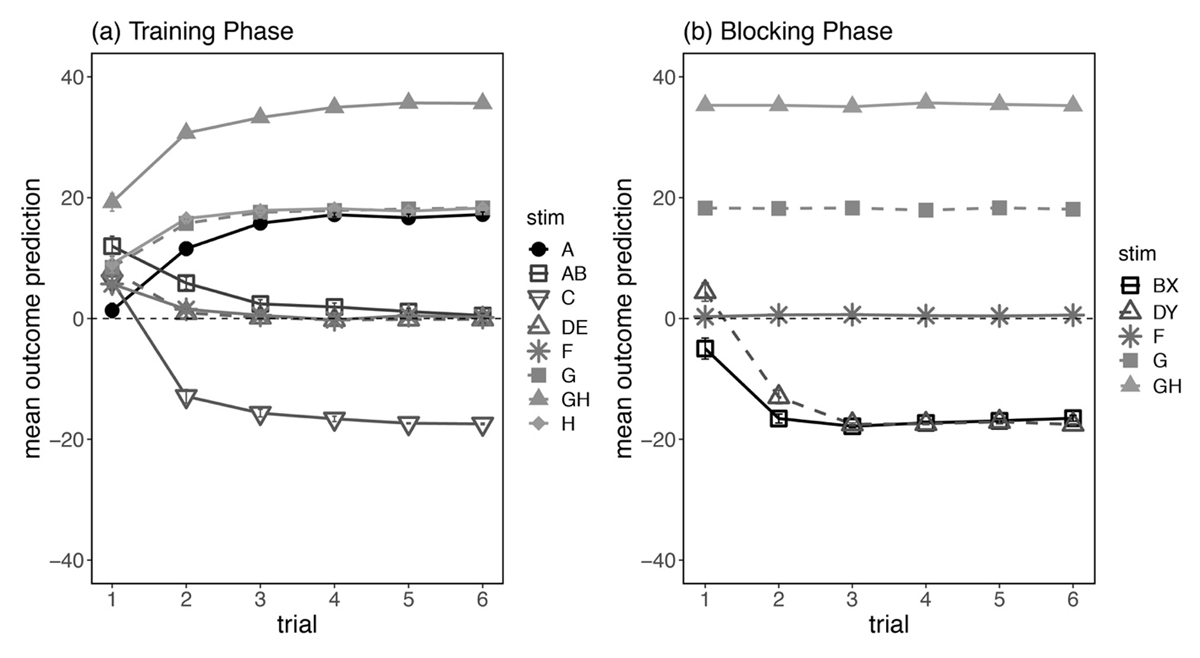
Figure 6
Mean Outcome Prediction (±SE) During (a) Training and (b) Blocking Phase in Experiment 2.
Note: Filled symbols denote trials that were paired with a hormone level increase (e.g., G+20 and GH+40), and unfilled symbols denote trials that were followed by no change (F0) or by a hormone level decrease (e.g., BX-20 and DY-20).
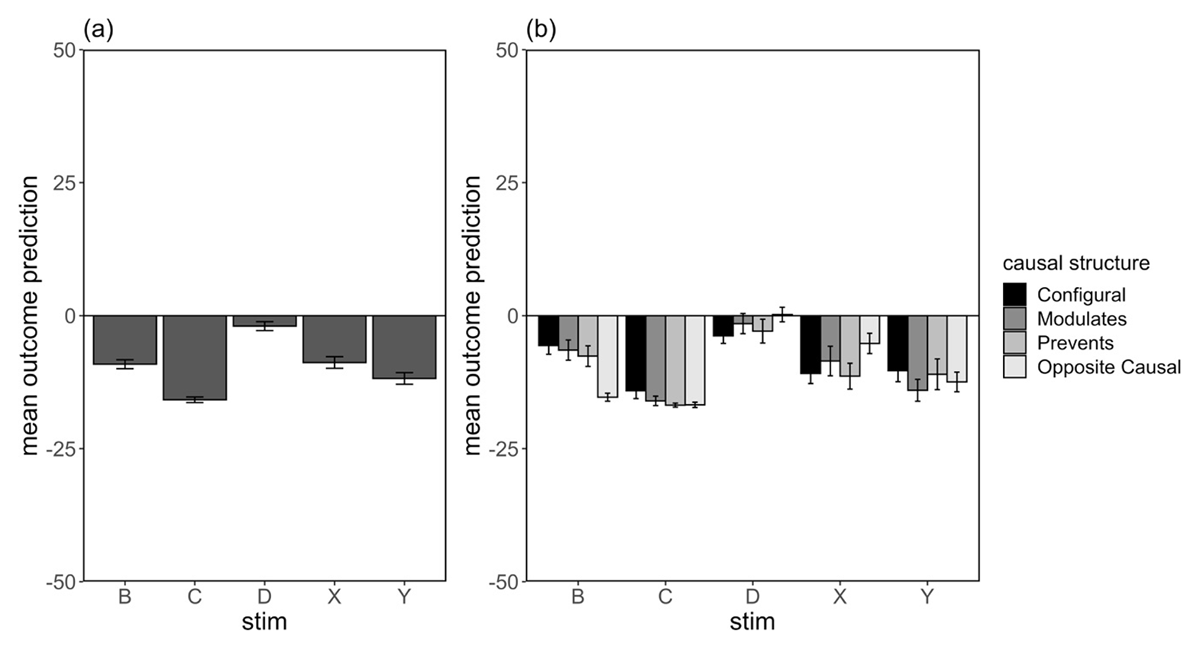
Figure 7
Average Outcome Prediction at Test (±SE) For Critical Stimuli (a) as a Group Average, and (b) Separated By Causal Structure Subgroup in Experiment 2.
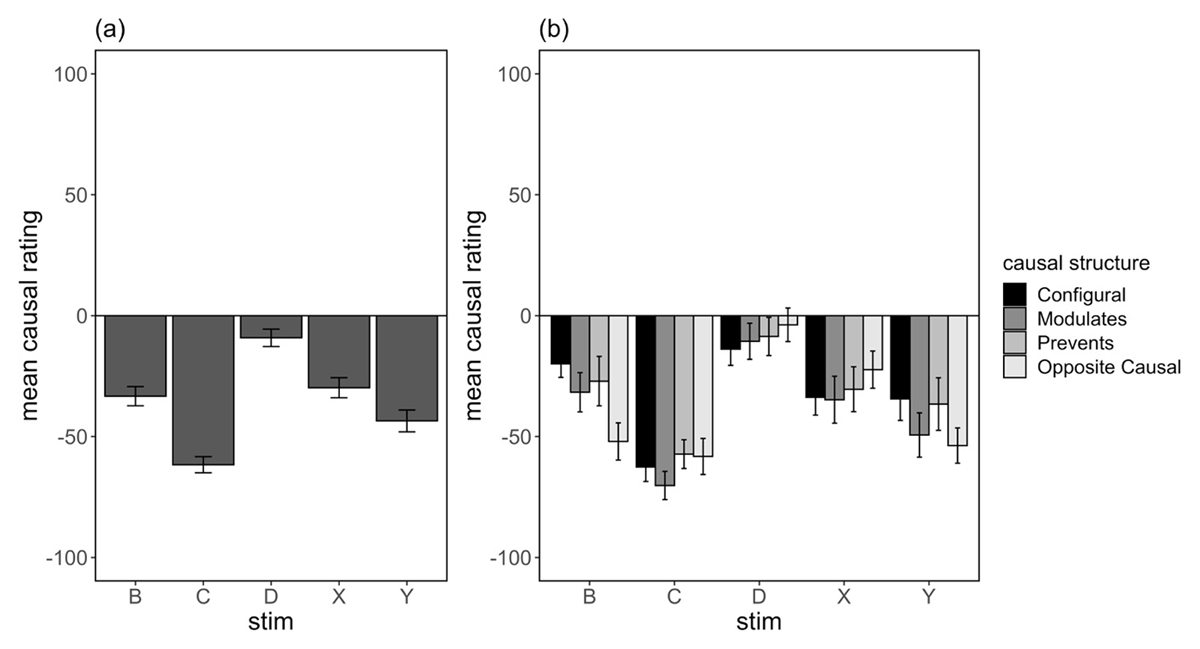
Figure 8
Mean Causal Ratings at Test (±SE) for Critical Cues (a) as a Group Average, and (b) Separated by Causal Structure Subgroup in Experiment 2.