
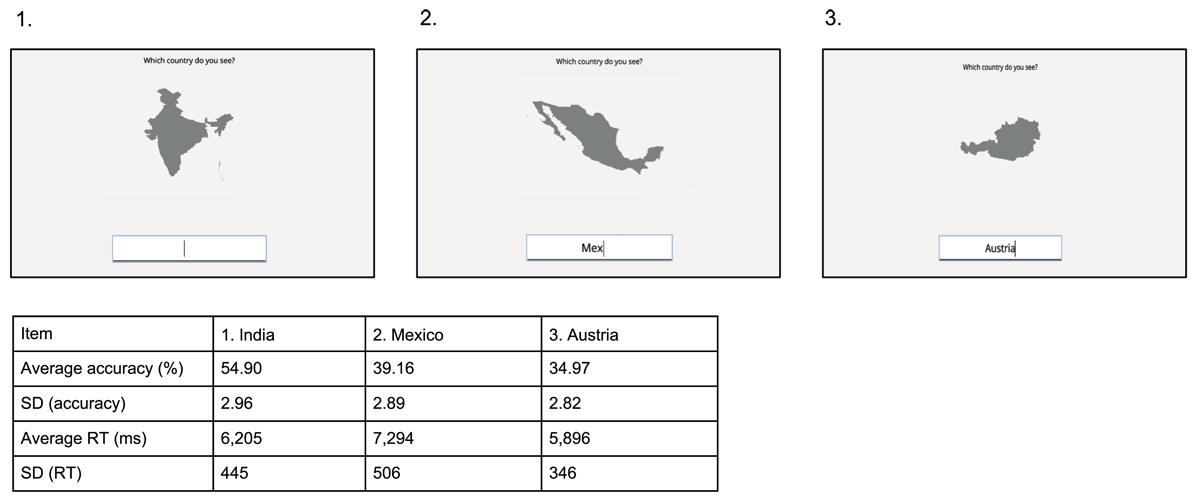
Figure 1
Country outlines were presented on the screen, and the participant was asked to type the correct name of the country in the text box. Normative accuracy and response time scores (see below for more details) of the three depicted countries are shown in the table below the figure.
Table 1
Column names and descriptions for the full dataset.
| COLUMN | DESCRIPTION |
|---|---|
| rt | The response time in ms, measured by first key press (unless the backspace key was used, in which case we report an infinite response time (Inf)) |
| trial_index | The index of the current trial |
| time_elapsed | The time elapsed in ms since the start of the experiment |
| participant_number | A unique id for each participant |
| id | A unique id for each country outline item |
| presentation_start_time | The start time of the trial, in ms elapsed since January 1, 1970, 00:00:00 UTC. |
| answer | The name of the presented country outline |
| correct | A binary accuracy of the response |
| backspace used | A logical variable indicating whether the backspace key was used in the response |
| response | The response entered by the participant |
| attempt | A binary variable indicating if the participant gave a response of at least two characters in length |
| rt_under_800 | A variable indicating if the participant responded within 800 ms from stimulus presentation |
Table 2
Column names and descriptions for the normative data file.
| COLUMN | DESCRIPTION |
|---|---|
| answer | The name of the presented country outline |
| accuracy | The proportion of correct responses for the current item over all participants |
| accuracy_sd | The standard deviation for correctness on the current item over all participants |
| rt | The overall average response time for the current item over all participants in milliseconds (including response times for incorrect responses). |
| rt_sd | The standard deviation for response times for the current item over all participants in milliseconds |
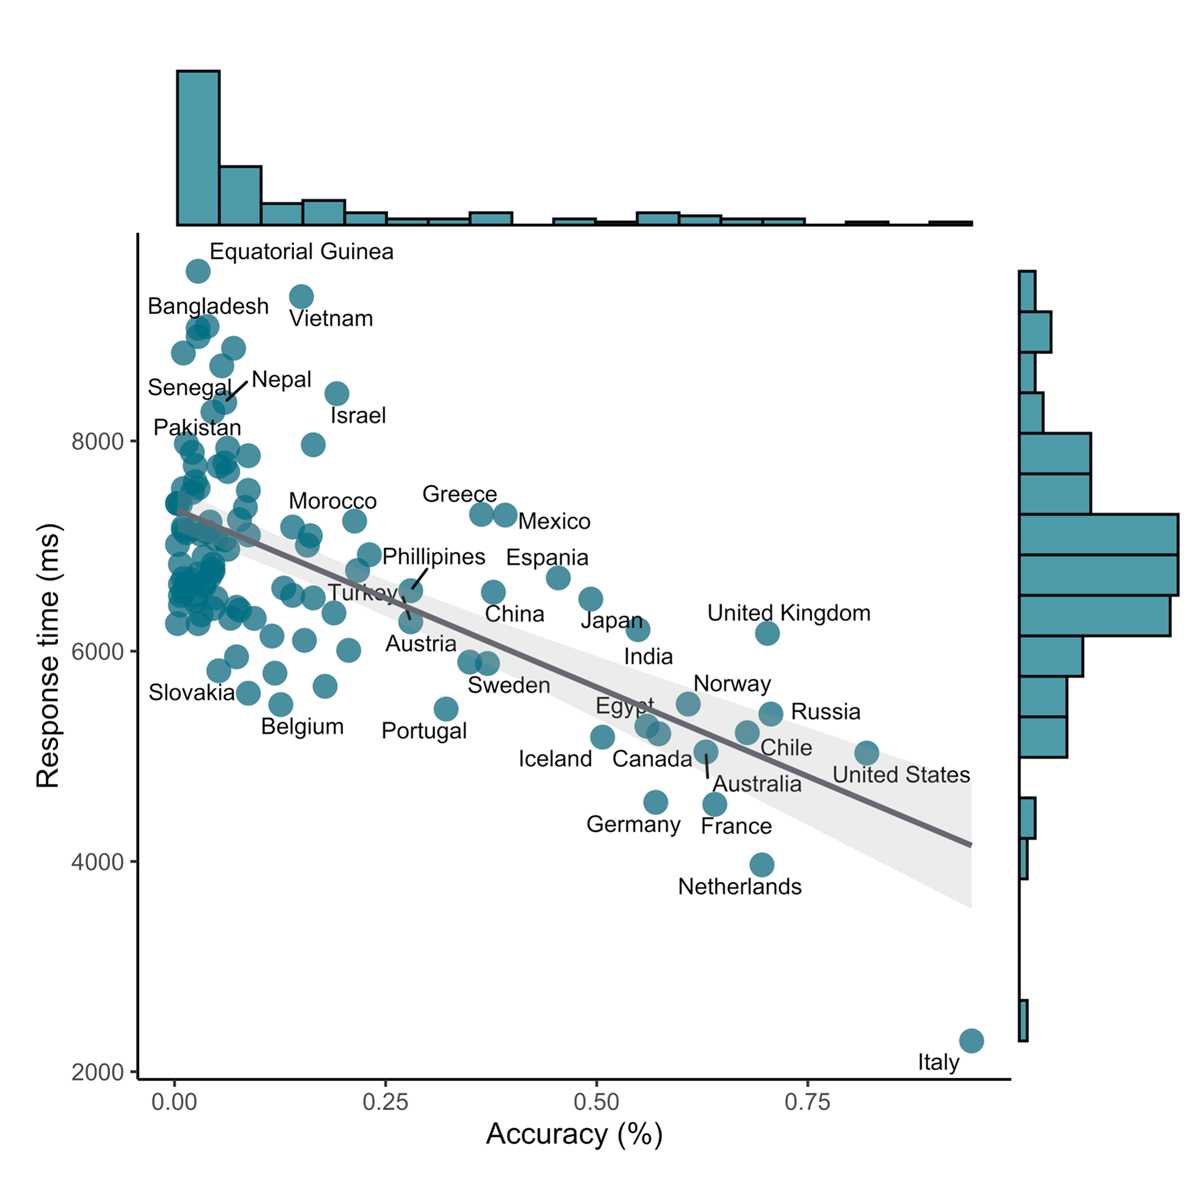
Figure 2
Association between average response times and accuracy. Marginal distributions of response times and accuracy are also shown. Points represent individual items, the gray line represents a linear model capturing the negative association between response times and accuracy scores. The shaded area represents a 95% confidence interval.
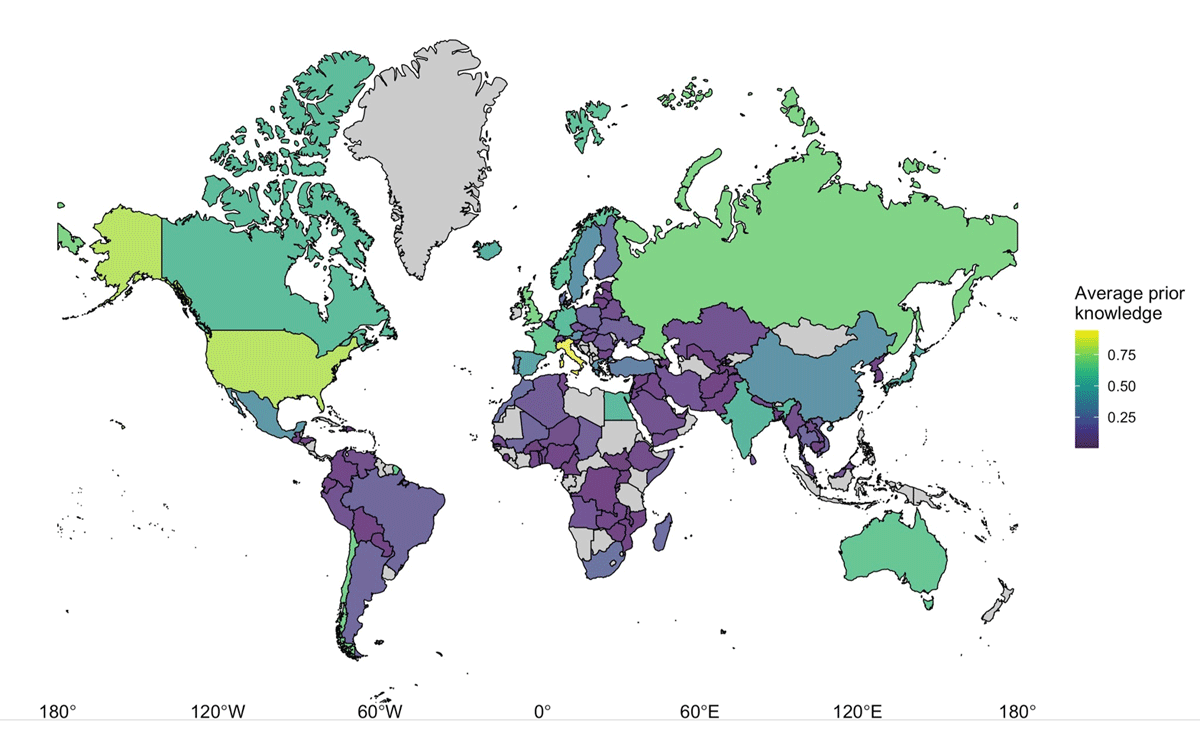
Figure 3
Average proportion of correct responses for each country. Uncolored countries were not presented in the current study. Note that this projection is landmass inaccurate: sizes away from the equator are inflated.