
Table 1
Participant characteristics.
| VARIABLE | HW (n = 35) | OB (n = 31) | t(64) | p | ||||
|---|---|---|---|---|---|---|---|---|
| M | SD | RANGE | M | SD | RANGE | |||
| Age | 43.3 | 9.0 | 27–54 | 43.3 | 9.3 | 28–55 | 0.34 | .97 |
| BMI | 22.0 | 1.8 | 20.3–24.2 | 37.0 | 5.2 | 30.5–44.8 | 16.05 | < .000 |
| RS | 10.4 | 5.0 | 2–23 | 17.5 | 4.5 | 10–26 | 6.17 | < .001 |
[i] Note: BMI = Body Mass Index, RS = Restraint Scale (Herman & Polivy, 1980). Abbreviations: HW = healthy-weight-category BMI; OB = obese BMI.
Table 2
Main effect of mindset per item of the mindset manipulation check. Reported Cohen’s d reflect the mindset manipulation’s effect size across BMI-groups.
| ITEMS | F (1,64) | p | d |
|---|---|---|---|
| Imagination (a) | 3.91 | .052 | .28 |
| Immersion (b) | 10.50 | .002 | .39 |
| Health (c) | 7.74 | .007 | .33 |
| Indulge (d) | 9.30 | .003 | .39 |
| Enjoyment (e) | 10.02 | .002 | .38 |
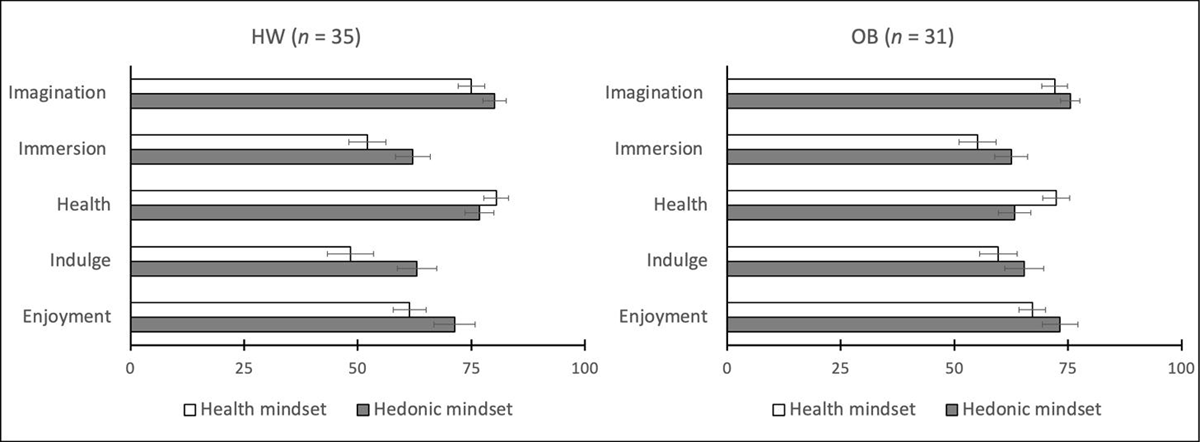
Figure 1
Mindset manipulation check results displayed per item and BMI-group (left graph: participants with healthy-weight-category BMI, right graph: participants with obesity). Error bars reflect 1 standard error of the mean in each direction. Abbreviations: HW = healthy-weight-category BMI; OB = obese BMI.
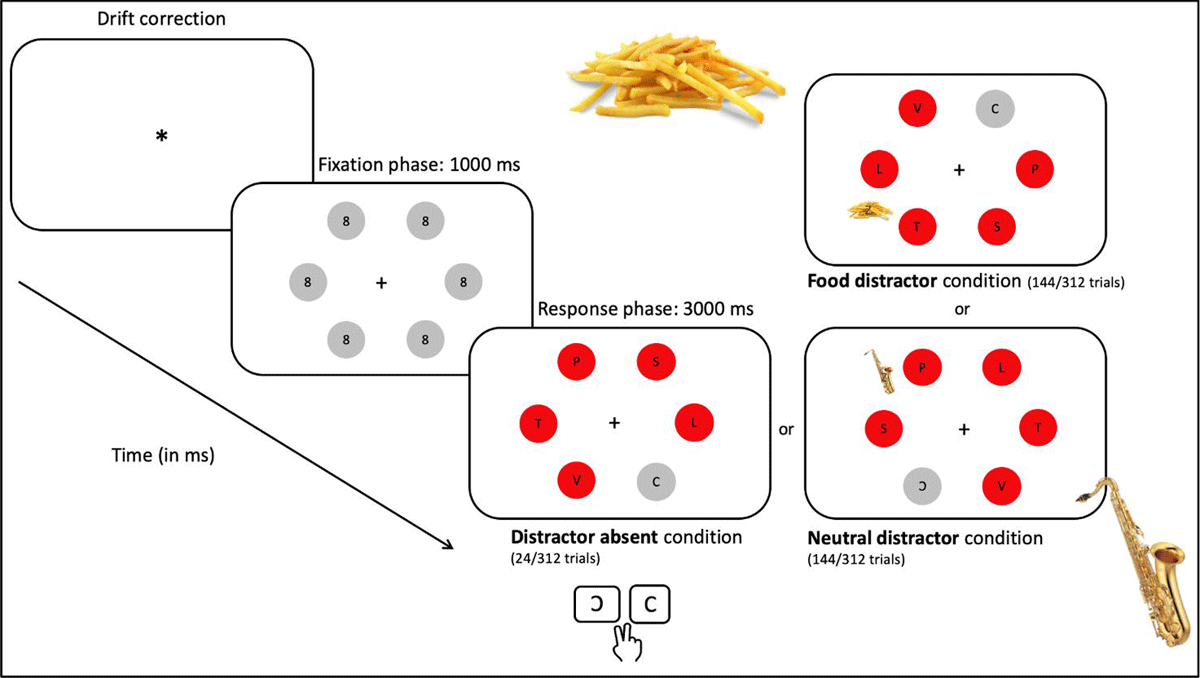
Figure 2
Graphical representation of the modified Additional Singleton paradigm (ASP). Distractors were presented at either 150° (top-right search-display) or 90° (bottom-right search-display) separation from the target.
Table 3
Mean and SD of the hunger check variables per BMI-group and per mindset.
| HUNGER CHECK VARIABLES | HW (n = 35) | OB (n = 31) | ||
|---|---|---|---|---|
| HEALTH MINDSET | HEDONIC MINDSET | HEALTH MINDSET | HEDONIC MINDSET | |
| M (SD) | M (SD) | M (SD) | M (SD) | |
| Hunger level (VAS) | 21.25 (14.91) | 20.20 (14.56) | 23.90 (12.24) | 24.80 (13.07) |
| Last eating moment (min) | 134.14 (22.63) | 134.28 (18.67) | 130.64 (16.52) | 137.09 (21.32) |
[i] Abbreviations: HW = healthy-weight-category BMI; OB = obese BMI.
Table 4
Response accuracy per condition of the design.
| HW (n = 35) | OB (n= 31) | |||||||
|---|---|---|---|---|---|---|---|---|
| HEALTH M | HEDONIC M | HEALTH M | HEDONIC M | |||||
| NEUTRAL D | FOOD D | NEUTRAL D | FOOD D | NEUTRAL D | FOOD D | NEUTRAL D | FOOD D | |
| M (SD) | M (SD) | M (SD) | M (SD) | M (SD) | M (SD) | M (SD) | M (SD) | |
| Accuracy (%) | 98.83 (1.40) | 98.73 (1.19) | 98.79 (1.01) | 99.08 (0.88) | 98.54 (1.55) | 98.43 (1.30) | 98.01 (2.43) | 98.33 (1.48) |
[i] Abbreviations: HW = healthy-weight-category BMI; OB = obese BMI; D = distractor type; M = mindset; BMI = Body Mass Index.
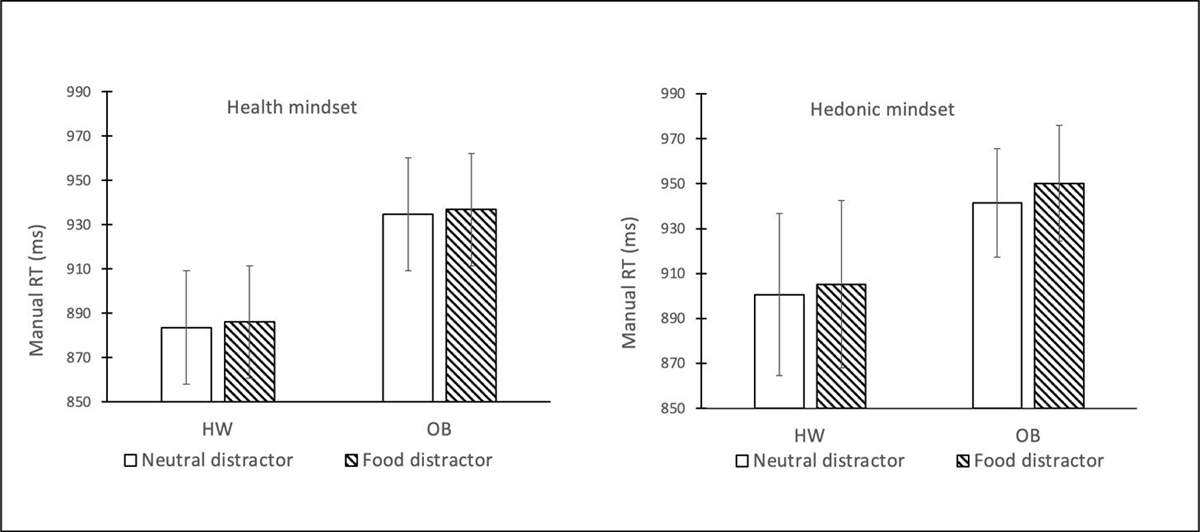
Figure 3
Average manual response latency per condition of the design. Error bars reflect 1 standard error of the mean in each direction. Abbreviations: HW = healthy-weight-category BMI; OB = obese BMI.
Table 5
Eye-movements’ variables.
| VARIABLES (n = 3) | HW (n = 35) | OB (n = 31) | D | D*M | D*BMI | D*M*BMI | ||||||||||
|---|---|---|---|---|---|---|---|---|---|---|---|---|---|---|---|---|
| HEALTH M | HEDONIC M | HEALTH M | HEDONIC M | |||||||||||||
| NEUTRAL D | FOOD D | NEUTRAL D | FOOD D | NEUTRAL D | FOOD D | NEUTRAL D | FOOD D | |||||||||
| M (SD) | M (SD) | M (SD) | M (SD) | M (SD) | M (SD) | M (SD) | M (SD) | F(1,64) | p | F(1,64) | p | F(1,64) | p | F(1,64) | p | |
| Percentage of trials with a fixation on the distractor | 9.54 (14.16) | 10.03 (17.34) | 9.40 (15.30) | 9.09 (17.34) | 10.83 (11.85) | 11.12 (12.09) | 14.15 (18.40) | 13.85 (18.05) | 0.09 | 0.92 | 1.47 | 0.23 | 0.01 | 0.91 | 0.03 | 0.86 |
| Duration (in ms) of the 1st fixation on the distractor (a) | 97.70 (35.36) | 86.96 (37.18) | 99.27 (33.34) | 97.09 (35.02) | 108.63 (35.40) | 104.72 (32.66) | 105.64 (35.64) | 107.01 (41.01) | 2.61 | 0.11 | 1.22 | 0.27 | 1.18 | 0.28 | 0.07 | 0.79 |
| Total dwell time (in ms) on the distractor (b) | 113.55 (57.22) | 102.30 (60.86) | 113.00 (65.52) | 118.42 (86.00) | 134.19 (74.22) | 128.98 (57.74) | 131.92 (79.94) | 127.23 (65.24) | 0.59 | 0.45 | 1.25 | 0.27 | 0.04 | 0.84 | 1.10 | 0.30 |
[i] Note: (a) and (b): reduced sample due to missing data, because some participants did not fixate the distractor. In total n = 54 participants out of n = 66, of which n = 27 with healthy-weight-category BMI and n = 27 with obesity. Abbreviations: HW = healthy-weight-category BMI; OB = obese BMI; D = distractor type; M = mindset; BMI = Body Mass Index.
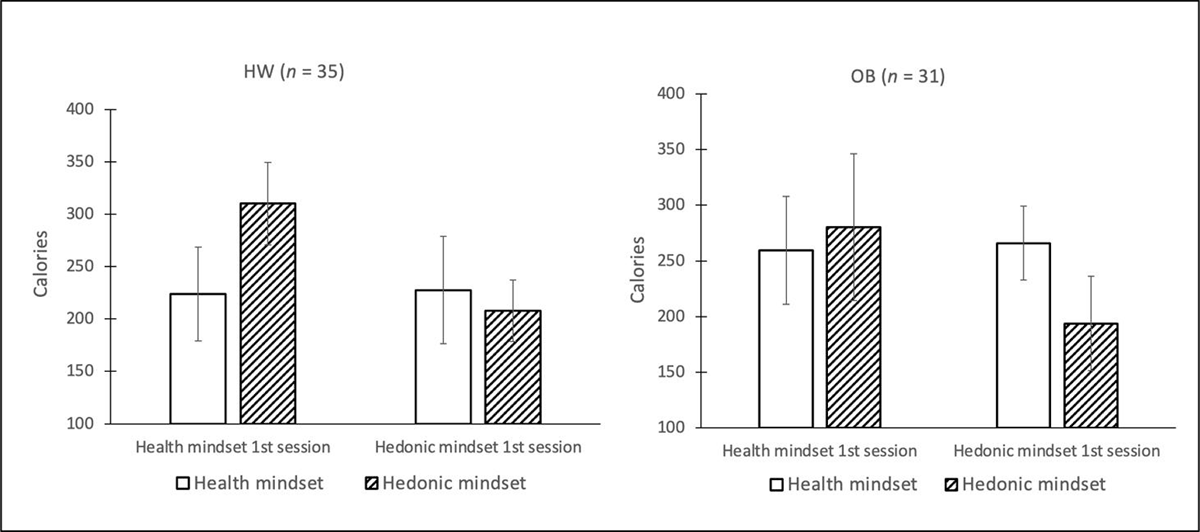
Figure 4
Food intake during bogus taste test per condition. Error bars reflect 1 standard error of the mean in each direction. Abbreviations: HW = healthy-weight-category BMI; OB = obese BMI.
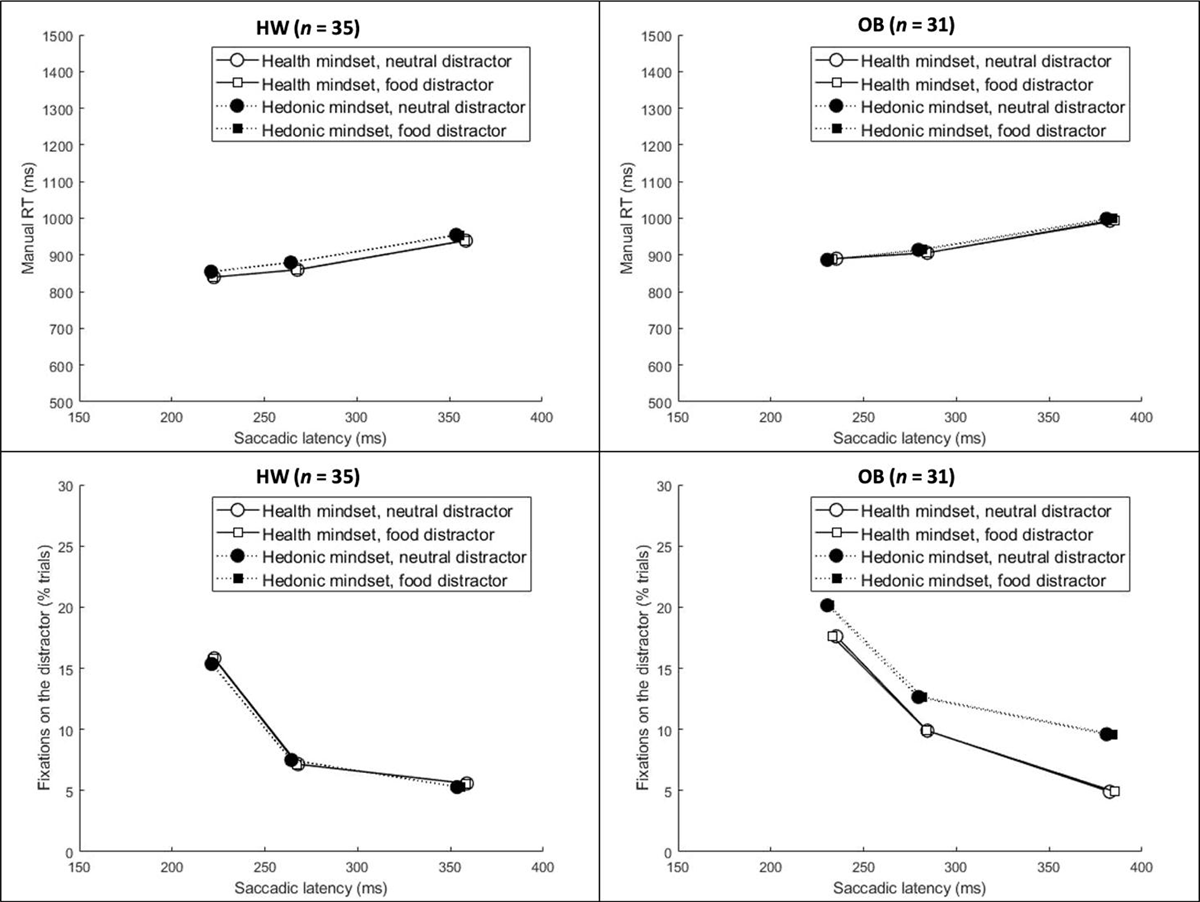
Figure 5
Top panels: Average manual RT as a function of first saccade latency, mindset, and distractor type. Bottom panels: The average proportion of trials with a fixation on the distractor as a function of first saccade latency, mindset, and distractor type. Abbreviations: HW = healthy-weight-category BMI; OB = obese BMI.