
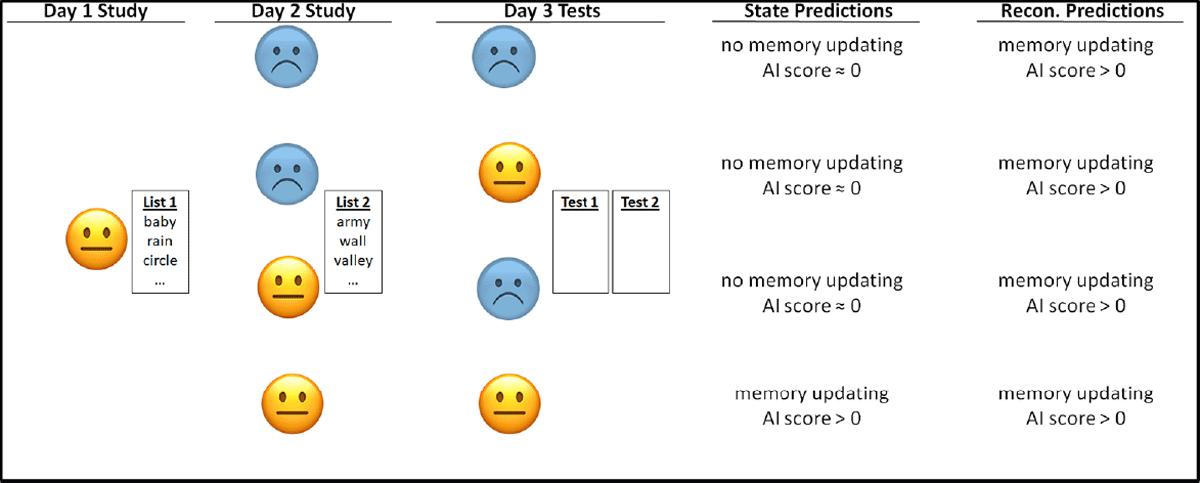
Figure 1
Mood manipulation design of Experiment 1. No mood was induced on Day 1; it was assumed to be neutral.
Table 1
Mean PANAS difference scores (and standard deviations).
| EXPERIMENT 1 | EXPERIMENT 2 | |||||
|---|---|---|---|---|---|---|
| DAY 2 | DAY 3 | DAY 1 | DAY 2 | DAY 3 | ||
| Negative | .17 | .26 | .20 | .06 | .35 | |
| (1.25) | (1.34) | (1.07) | (1.22) | (1.30) | ||
| Neutral | 1.28 | 1.30 | 1.22 | .99 | ||
| (1.08) | (1.04) | (.89) | (.66) | |||
Table 2
Means (and standard deviations) of blocks to acquisition on Days 1 and 2 in Experiment 1.
| BLOCKS DAY 1 | BLOCKS DAY 2 | ||||
|---|---|---|---|---|---|
| DAY 2 MOOD | DAY 2 MOOD | ||||
| NEGATIVE | NEUTRAL | NEGATIVE | NEUTRAL | ||
| Day 3 Mood | |||||
| Negative | 2.80 | 2.60 | 2.40 | 2.50 | |
| (.68) | (.99) | (.99) | (.89) | ||
| Neutral | 2.38 | 3.13 | 2.13 | 2.81 | |
| (1.09) | (.50) | (.72) | (.66) | ||
Table 3
Mean free recall accuracy (and standard deviations) on Day 3 for Experiment 1.
| ACCURACY LIST 1 | ACCURACY LIST 2 | ||||
|---|---|---|---|---|---|
| DAY 2 MOOD | DAY 2 MOOD | ||||
| NEGATIVE | NEUTRAL | NEGATIVE | NEUTRAL | ||
| Day 3 Mood | |||||
| Negative | 11.25 | 9.13 | 12.50 | 13.81 | |
| (5.14) | (3.54) | (5.11) | (4.61) | ||
| Neutral | 12.25 | 10.31 | 15.31 | 11.69 | |
| (5.73) | (5.17) | (5.42) | (3.91) | ||
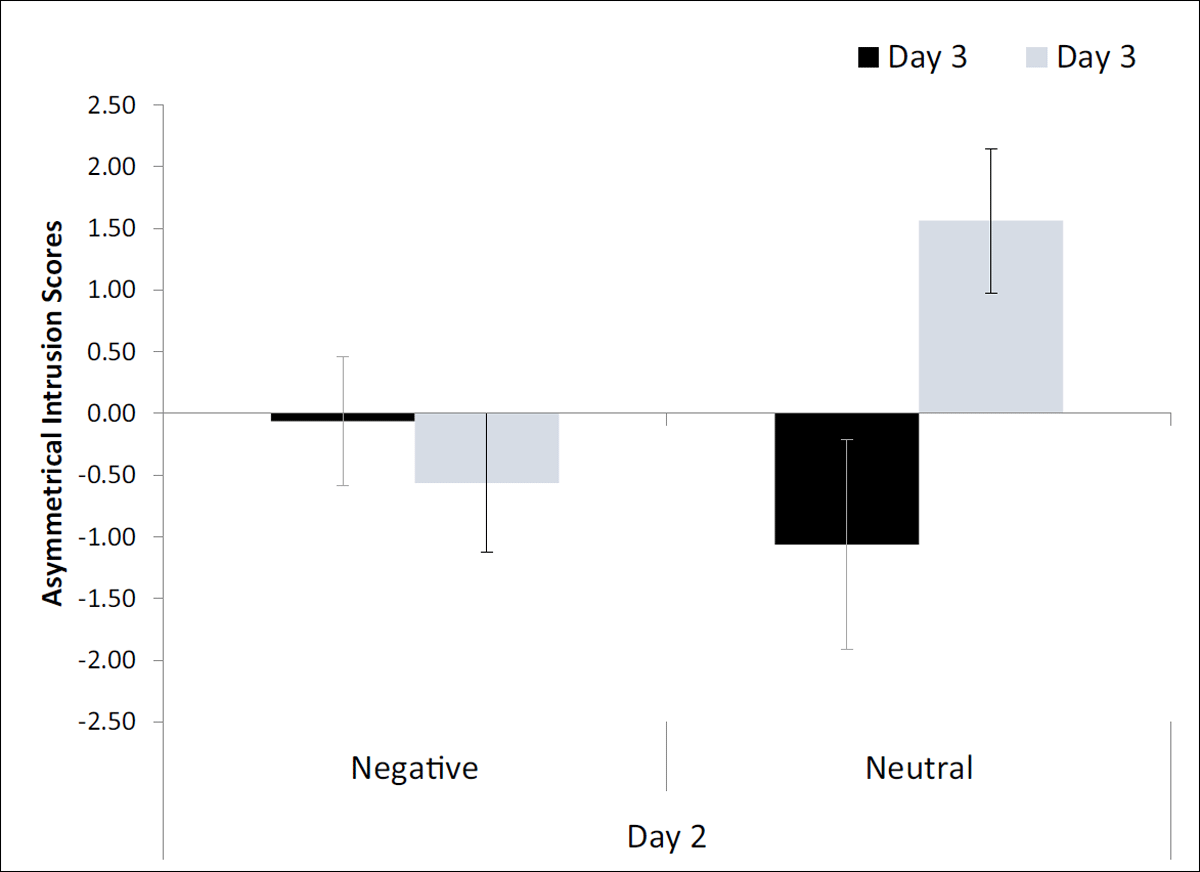
Figure 2
AI scores as a function of mood on Day 2 and Day 3 in Experiment 1. Error bars represent one standard error.
Table 4
Mean raw intrusions (and standard deviations) for List 2 into List 1 and List 1 into List 2 as a function of mood sate. Mood was (assumed) neutral on Day 1 in all conditions.
| LIST 2 → LIST 1 INTRUSIONS | LIST 1 → LIST 2 INTRUSIONS | ||||
|---|---|---|---|---|---|
| DAY 2 MOOD | DAY 2 MOOD | ||||
| NEGATIVE | NEUTRAL | NEGATIVE | NEUTRAL | ||
| Day 3 Mood | |||||
| Negative | 2.69 | 2.38 | 2.75 | 3.44 | |
| (2.89) | (2.25) | (3.73) | (2.56) | ||
| Neutral | 1.75 | 3.94 | 2.31 | 2.38 | |
| (2.59) | (2.54) | (1.85) | (2.19) | ||
Table 5
Means (and standard deviations) of blocks to acquisition on Days 1 and 2 in Experiment 1.
| BLOCKS DAY 1 | BLOCKS DAY 2 | ||||
|---|---|---|---|---|---|
| DAY 2 MOOD | DAY 2 MOOD | ||||
| NEGATIVE | NEUTRAL | NEGATIVE | NEUTRAL | ||
| Day 3 Mood | |||||
| Negative | 2.64 | 2.67 | 2.29 | 2.56 | |
| (.63) | (1.05) | (1.27) | (.73) | ||
| Neutral | 2.94 | 2.62 | 2.38 | 2.36 | |
| (.93) | (.65) | (.62) | (.50) | ||
Table 6
Mean free recall accuracy (and standard deviations) on Day 3 for Experiment 2.
| ACCURACY LIST 1 | ACCURACY LIST 2 | ||||
|---|---|---|---|---|---|
| DAY 2 MOOD | DAY 2 MOOD | ||||
| NEGATIVE | NEUTRAL | NEGATIVE | NEUTRAL | ||
| Day 3 Mood | |||||
| Negative | 9.75 | 10.75 | 12.56 | 14.50 | |
| (6.54) | (3.71) | (5.28) | (4.56) | ||
| Neutral | 11.25 | 10.75 | 13.75 | 14.94 | |
| (2.82) | (4.23) | (4.04) | (5.08) | ||
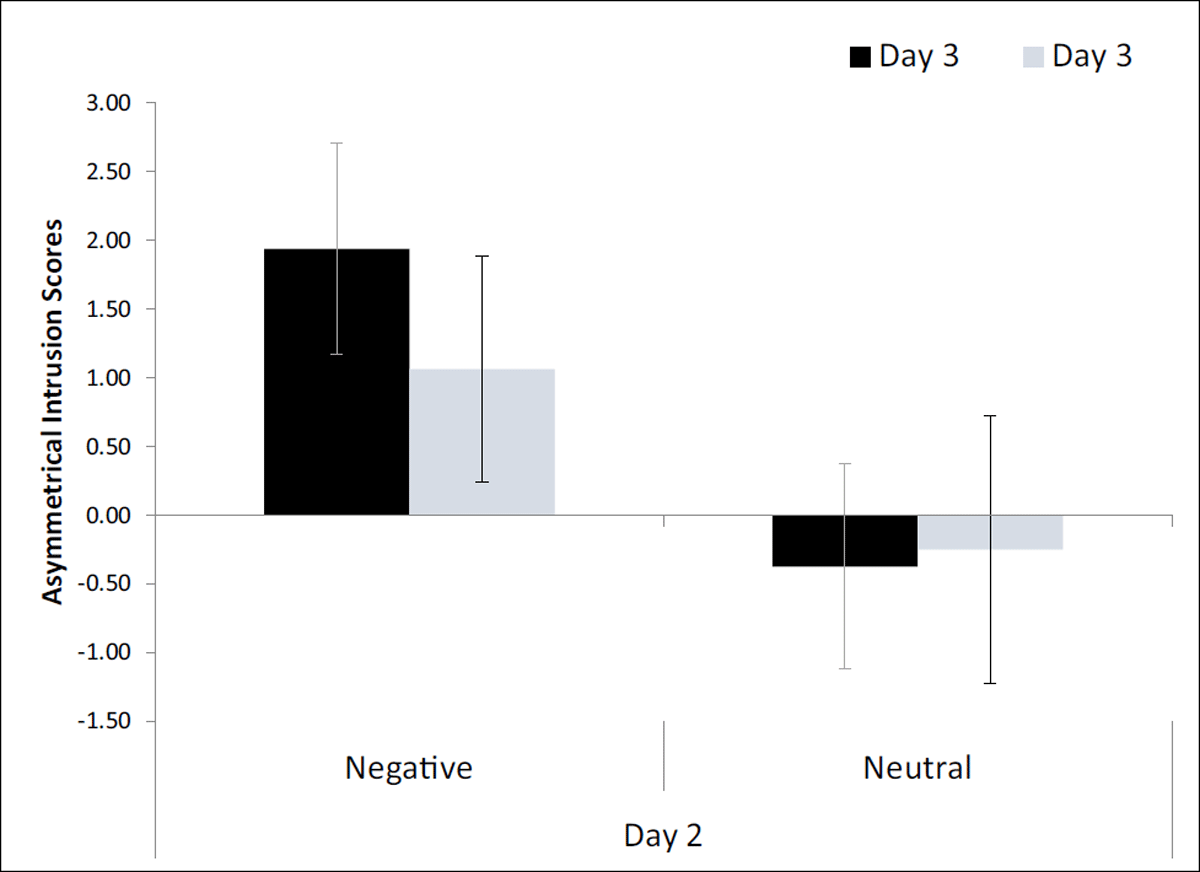
Figure 3
Asymmetrical intrusion scores for Experiment 2. All participants were in a negative mood on Day 1. Error bars represent standard error.
Table 7
Mean raw intrusions (and standard deviations) for List 2 into List 1 and List 1 into List 2 as a function of mood sate. Mood was negative for Day 1 in all conditions.
| LIST 2 → LIST 1 INTRUSIONS | LIST 1 → LIST 2 INTRUSIONS | ||||
|---|---|---|---|---|---|
| DAY 2 MOOD | DAY 2 MOOD | ||||
| NEGATIVE | NEUTRAL | NEGATIVE | NEUTRAL | ||
| Day 3 Mood | |||||
| Negative | 3.00 | 2.13 | 2.56 | 2.50 | |
| (4.32) | (2.03) | (2.28) | (1.67) | ||
| Neutral | 3.19 | 2.69 | 2.13 | 2.94 | |
| (2.48) | (2.30) | (1.75) | (3.09) | ||
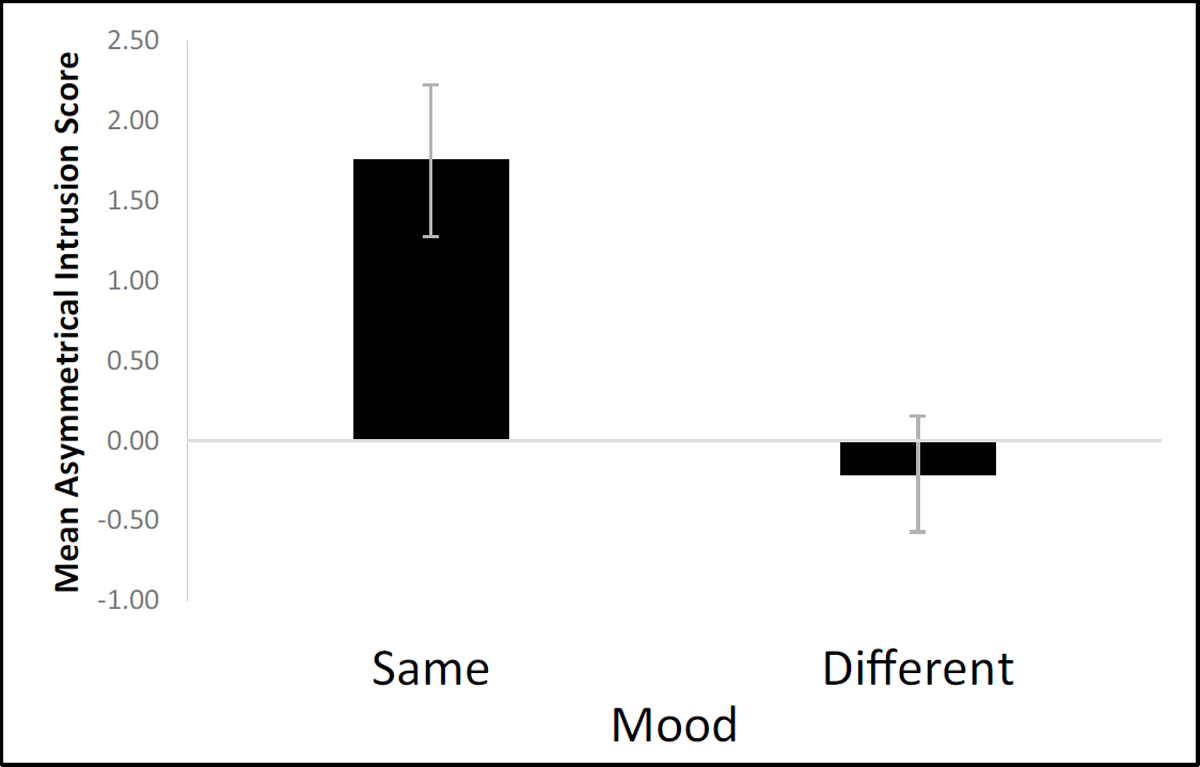
Figure 4
AI scores collapsed across experiments and conditions as a function of mood, which was the same on all three days (n = 32) or differed across days (n = 96), t(126) = 3.25, p < .001, Cohen’s d = .631. Error bars represent one standard error of the mean.