
Table 1
Participants’ characteristics (Expt. 1).
| Characteristics | Young adults | Older adults | ||||
|---|---|---|---|---|---|---|
| Control condition | Success condition | F | Control condition | Success condition | F | |
| N (females) | 23 (11) | 23 (14) | — | 23 (15) | 23 (13) | — |
| Mean age (years ; months) | 24;6 | 23;1 | 1.69 | 71;0 | 70;0 | 0.26 |
| Age range | 18;0–32;0 | 18;0–30;0 | — | 59;2–84;4 | 61;0–83;0 | — |
| Number of years of education | 11.5 | 11.7 | 0.2 | 11.9 | 11.8 | .14 |
| Arithmetic fluency (SD) | 59.7 (12.1) | 60.0 (15.9) | 0.00 | 69.6 (9.0) | 70.7 (13.1) | 0.12 |
| MHVS1 (SD) | 24.4 (4.8) | 23.2 (4.8) | 0.74 | 24.0 (2.3) | 24.5 (4.6) | 0.58 |
| MMSE2 | — | — | — | 29.0 | 29.1 | — |
[i] Note. 1Mill-Hill Vocabulary Scale, 2Mini-Mental State Examination.
Table 2
Mean percentages of better strategy selection, mean estimation times, and percentages of errors in young and older adults under the success and control conditions for rounding-down and rounding-up prime problems (Expt. 1).
| Problem Type | Young adults | Older adults | Means | |||||||||
|---|---|---|---|---|---|---|---|---|---|---|---|---|
| Control | Success | Differences | Means | Control | Success | Differences | Means | Control | Success | Differences | Means | |
| Percentages of Better Strategy Selection | ||||||||||||
| Rounding-Down | 96.2 | 97.8 | –1.6 | 97.0 | 97.8 | 98.1 | –0.3 | 98.0 | 97.0 | 98.0 | –1.0 | 97.5 |
| Rounding-Up | 98.4 | 94.8 | 3.5 | 96.6 | 92.7 | 93.8 | –1.1 | 93.2 | 95.5 | 94.3 | 1.2 | 94.9 |
| Means | 97.3 | 96.3 | 1.0 | 96.8 | 95.2 | 95.9 | –0.7 | 95.6 | 96.3 | 96.1 | 0.1 | 96.2 |
| Estimation Times (in ms) | ||||||||||||
| Rounding-Down | 3424 | 3748 | –325 | 3586 | 5193 | 4037 | 1156 | 4615 | 4308 | 3893 | 415 | 4100 |
| Rounding-Up | 3758 | 4227 | –469 | 3993 | 5780 | 4344 | 1436 | 5062 | 4769 | 4286 | 483 | 4528 |
| Means | 3591 | 3988 | –397 | 3789 | 5486 | 4191 | 1296 | 4838 | 4539 | 4089 | 449 | 4314 |
| Percentages of errors | ||||||||||||
| Rounding-Down | 1.1 | 0.0 | 1.1 | 0.5 | 0.6 | 0.0 | 0.6 | 0.3 | 0.8 | 0.0 | 0.8 | 0.4 |
| Rounding-Up | 1.4 | 0.1 | 1.3 | 0.8 | 1.1 | 0.4 | 0.6 | 0.8 | 1.2 | 0.3 | 0.9 | 0.8 |
| Means | 1.3 | 0.1 | 1.2 | 0.7 | 0.8 | 0.2 | 0.6 | 0.5 | 1.0 | 0.1 | 0.9 | 0.6 |
Table 3
Mean percentages of better strategy selection, mean estimation times, and percentages of errors in young and older adults in the success and control conditions for rounding-down, rounding-up, and neutral target problems (Expt. 1).
| Problem Type | Young adults | Older adults | Means | |||||||||
|---|---|---|---|---|---|---|---|---|---|---|---|---|
| Control | Success | Differences | Means | Control | Success | Differences | Means | Control | Success | Differences | Means | |
| Percentages of Better Strategy Selection | ||||||||||||
| Rounding-Down | 70.4 | 72.1 | 1.7 | 71.2 | 64.3 | 72.3 | 8.0 | 68.3 | 67.3 | 72.2 | 4.8 | 69.8 |
| Rounding-Up | 78.4 | 72.3 | –6.1 | 75.3 | 65.7 | 80.6 | 14.8 | 73.1 | 72.0 | 76.4 | 4.4 | 74.2 |
| Means | 74.4 | 72.2 | –2.2 | 73.3 | 65.0 | 76.4 | 11.4 | 70.7 | 69.7 | 74.3 | 4.6 | 72.0 |
| Estimation Times (in ms) | ||||||||||||
| Rounding-Down | 4526 | 4679 | 153 | 4602 | 6287 | 4950 | –1338 | 5619 | 5406 | 4814 | –592 | 5110 |
| Rounding-Up | 4645 | 4891 | 246 | 4768 | 6736 | 5240 | –1496 | 5988 | 5690 | 5066 | –625 | 5378 |
| Neutral | 4375 | 4504 | 129 | 4440 | 6208 | 4898 | –1310 | 5553 | 5292 | 4701 | –590 | 4996 |
| Means | 4515 | 4691 | 176 | 4603 | 6410 | 5029 | –1381 | 5720 | 5463 | 4860 | –603 | 5162 |
| Percentages of errors | ||||||||||||
| Rounding-Down | 0.5 | 1.7 | 1.2 | 1.1 | 1.8 | 0.6 | –1.2 | 1.2 | 1.2 | 1.2 | 0.0 | 1.2 |
| Rounding-Up | 0.5 | 1.2 | 0.6 | 0.9 | 2.0 | 0.0 | –2.0 | 1.0 | 1.3 | 0.6 | –0.7 | 0.9 |
| Neutral | 2.4 | 1.5 | –0.8 | 1.9 | 4.1 | 0.9 | –3.2 | 2.5 | 3.2 | 1.2 | –2.0 | 2.2 |
| Means | 1.1 | 1.5 | 0.3 | 1.3 | 2.6 | 0.5 | –2.1 | 1.6 | 1.9 | 1.0 | –0.9 | 1.4 |
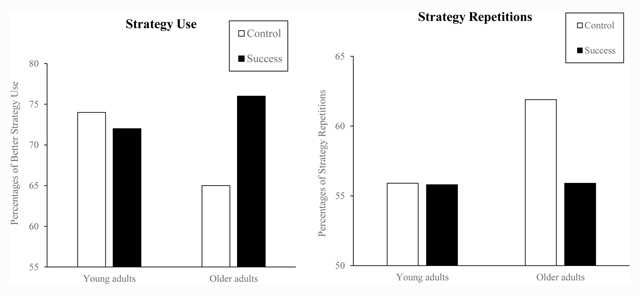
Figure 1
Young and Older Adults’ Strategy Use and Strategy Repetitions Under Control and Success Conditions (Expt. 1).
Table 4
Mean percentages of strategy repetitions in young and older adults under the success and control conditions for neutral, repeated, and unrepeated trials (Expt 1).
| Trials | Young adults | Older adults | ||||||
|---|---|---|---|---|---|---|---|---|
| Control | Success | Differences | Means | Control | Success | Differences | Means | |
| Neutral | 59.5 | 58.8 | 0.6 | 59.1 | 62.6 | 60.3 | 2.3 | 61.5 |
| Repeated | 78.3 | 77.9 | 0.4 | 78.1 | 76.8 | 80.1 | –3.3 | 78.5 |
| Unrepeated | 30.0 | 30.8 | –0.7 | 30.4 | 46.3 | 27.3 | 19.0 | 36.8 |
| Means | 55.9 | 55.8 | 0.1 | 55.9 | 61.9 | 55.9 | 6.0 | 58.9 |
[i] Note. Differences: Control – Success.
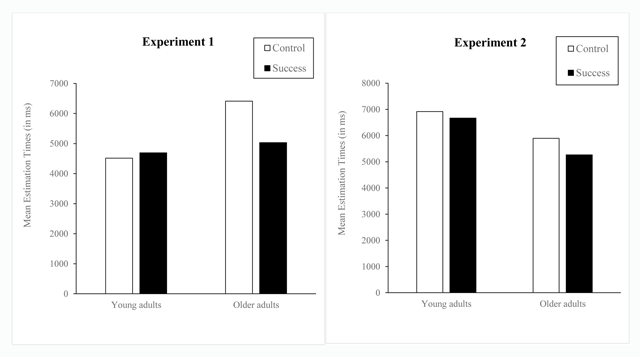
Figure 2
Mean Estimation Performance in Young and Older Adults Under Control and Success Conditions (Expts. 1 and 2).
Table 5
Participants’ characteristics (Expt. 2).
| Characteristics | Young adults | Older adults | ||||
|---|---|---|---|---|---|---|
| Control condition | Success condition | F | Control condition | Success condition | F | |
| N (females) | 27 (23) | 27 (21) | — | 30 19) | 30 (17) | — |
| Mean age (years;months) | 20;4 | 20;1 | 0.12 | 71;5 | 73;9 | 2.43 |
| Age range | 17;10–34;9 | 18;4–27;9 | — | 58;2–85;2 | 65;1–85;1 | — |
| Number of years of education | 11.8 | 11.6 | 0.91 | 11.7 | 11.5 | 0.73 |
| Arithmetic fluency | 39.2 | 39,9 | 0.05 | 76.0 | 77.3 | .06 |
| MHVS1 | 18.4 | 19.0 | 0.10 | 24.3 | 25.9 | 1.57 |
| MMSE2 | — | — | — | 29.7 | 29.5 | — |
[i] Note. 1 Mill-Hill Vocabulary Scale, 2 Mini-Mental State Examination.
Table 6
Mean estimation times and percentages of errors in young and older adults under the success and control conditions for the rounding-down and rounding-up strategies (Expt. 2).
| Conditions | Young adults | Older adults | Means | ||||||
|---|---|---|---|---|---|---|---|---|---|
| RD | RU | Means | RD | RU | Means | RD | RU | Means | |
| Estimation Times (in ms) | |||||||||
| Control | 6264 | 7566 | 6915 | 4594 | 5149 | 4871 | 5428 | 6357 | 5893 |
| Success | 6148 | 7184 | 6666 | 3581 | 4151 | 3866 | 4865 | 5667 | 5266 |
| Means | 6206 | 7375 | 6571 | 4088 | 4650 | 4369 | 5147 | 6012 | 5580 |
| Differences | 116 | 382 | 249 | 1013 | 998 | 1006 | 564 | 690 | 627 |
| Percentages of Errors | |||||||||
| Control | 7.8 | 14.0 | 10.9 | 3.3 | 7.2 | 5.3 | 5.6 | 10.6 | 8.1 |
| Success | 6.0 | 13.4 | 9.7 | 1.5 | 2.1 | 1.8 | 3.7 | 7.8 | 5.8 |
| Means | 6.9 | 13.7 | 10.3 | 2.4 | 5.1 | 3.6 | 4.7 | 9.2 | 6.9 |
| Differences | 1.9 | 0.6 | 1.2 | 1.8 | 4.7 | 3.4 | 1.8 | 2.8 | 2.3 |
[i] Note. RD: Rounding-down strategy; RU: Rounding-up strategy. Differences = Control – Success.