
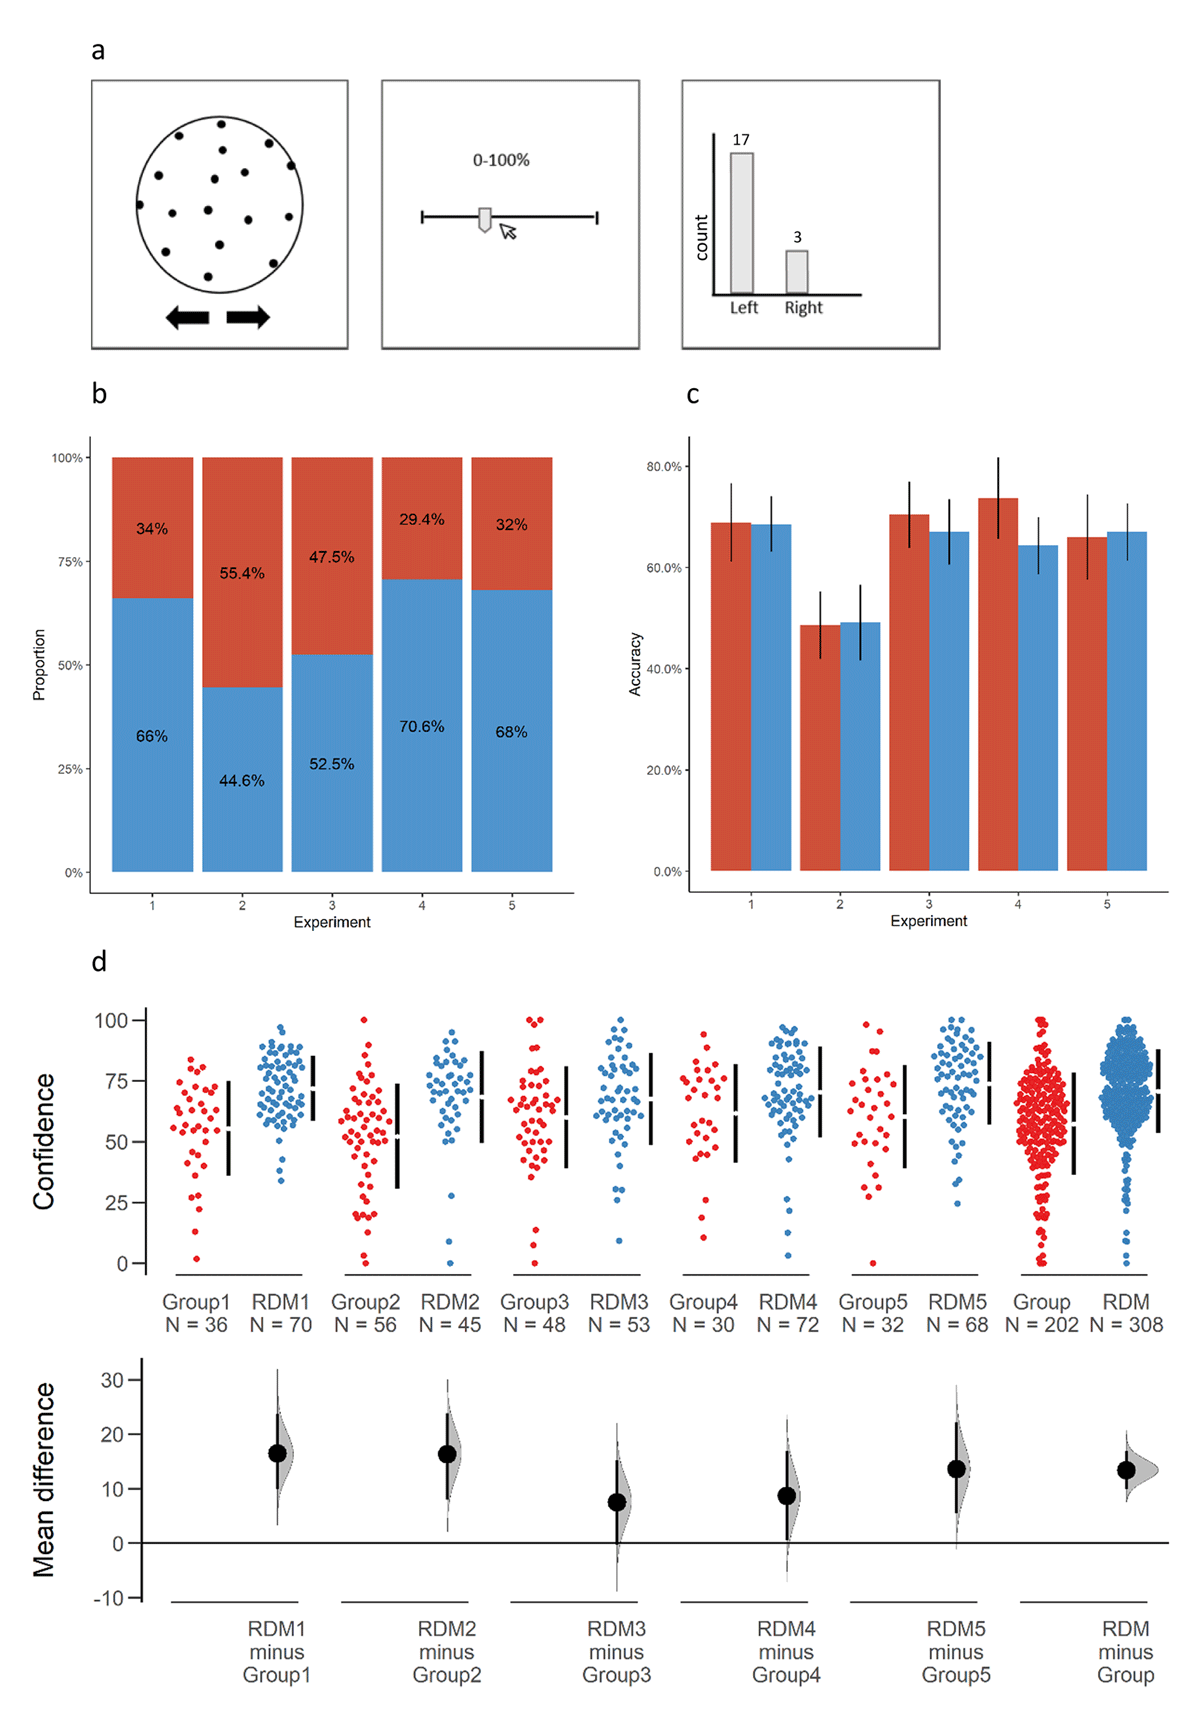
Figure 1
(a) A practice-phase trial in Experiment 1. (b) Distribution of choices in the test trial across all 5 experiments. (c) Practice-phase mean accuracy rates (±SE) in each experiment. (d) A multi two-group estimation plot (Ho et al., 2019). The scatter plot shows the observed confidence levels of each group in each experiment (and in all experiments combined in the rightmost plot) during the practice phase. The vertical lines beside each group indicate the mean ± 1 standard deviation. The effect size (mean difference) and 95% CI are positioned below the raw data. The curve indicates the resampled distribution of the mean difference, given the observed data.
Table 1
Accuracy rates and confidence ratings in practice and test trials for Experiments 1–5.
| EXPERIMENT | DECISION | N | % | PRACTICE TRIALS | TEST TRIAL | ||
|---|---|---|---|---|---|---|---|
| CONFIDENCE (MEAN ± SD) | ACCURACY | CONFIDENCE (MEAN ± SD) | ACCURACY | ||||
| 1 | RDM | 70 | 66.0% | 71.8 (±13.3) | 68.6% | 75.1 (±16.3) | 78.6% |
| Group | 36 | 34.0% | 55.3 (±19.4) | 68.9% | 63.5 (±19.0) | 94.4% | |
| 2 | RDM | 45 | 44.6% | 68.4 (±18.9) | 49.1%* | 78.3 (±19.3) | 84.4% |
| Group | 56 | 55.4% | 52.1 (±21.6) | 48.6%* | 57.2 (±23.7) | 96.4% | |
| 3 | RDM | 53 | 52.5% | 67.5 (±18.8) | 67.0% | 73.9 (±22.1) | 84.9% |
| Group | 48 | 47.5% | 59.9 (±20.9) | 70.4% | 67.7 (±20.2) | 97.9% | |
| 4 | RDM | 72 | 70.6% | 70.3 (±18.6) | 64.3% | ||
| Group | 30 | 29.4% | 61.6 (±20.2) | 73.7% | |||
| 5 | RDM | 68 | 68% | 73.8 (±17.0) | 67.0% | 75.8 (±19.8) | 67.6% |
| Group | 32 | 32% | 60.2 (±21.2) | 66.0% | 65.9 (±21.5) | 93.7% | |
| Overall | RDM | 263 | 64.3% | 70.6 (±17.3) | 66.7%** | 75.7 (±19.2) | 78.0% |
| Group | 146 | 35.7% | 57.2 (±20.9) | 69.7%** | 63.1 (±21.7) | 95.9% | |
[i] * Accuracy here refers to congruence between participants’ decision and the group decision.
** Experiment 2 was excluded.
Table 2
Means and analysis of variance results for confidence judgments in practice trials.
| EXPERIMENT | DECISION | N* | CONFIDENCE | MAIN EFFECT OF CORRECTNESS | CORRECTNESS*CHOICE INTERACTION | |
|---|---|---|---|---|---|---|
| CORRECT TRIALS (MEAN ± SD) | INCORRECT TRIALS (MEAN ± SD) | |||||
| 1 | RDM | 69 | 73.3 (±12.9) | 68.6 (±16.5) | F(1,103) = 27.75, MSe = 46.53,p < .001, ηp2 = .21 | F(1,103) = .27, MSe = 46.53,p = .602, ηp2 = .003 |
| Group | 36 | 57.1 (±19.0) | 51.3 (±20.6) | |||
| 3 | RDM | 51 | 68.7 (±18.9) | 64.1 (±22.2) | F(1,95) = 18.29, MSe = 71.59,p < .001, ηp2 = .16 | F(1,95) = .22, MSe = 71.59,p = .643, ηp2 = .002 |
| Group | 46 | 60.7 (±20.3) | 54.9 (±22.4) | |||
| 4 | RDM | 70 | 71.7 (±17.5) | 69.3 (±19.3) | F(1,97) = 9.41, MSe = 62.27,p = .003, ηp2 = .09 | F(1,97) = 1.14, MSe = 62.27, p = .287, ηp2 = .012 |
| Group | 29 | 62.2 (±20.8) | 57.1 (±24.3) | |||
| 5 | RDM | 67 | 74.4 (±17.1) | 72.2 (±20.6) | F(1,97) = 3.32, MSe = 44.65,p = .072, ηp2 = .033 | F(1,97) = .12, MSe = 44.65,p = .730, ηp2 = .001 |
| Group | 32 | 60.3 (±21.9) | 58.8 (±20.7) | |||
| Overall | RDM | 257 | 72.3 (±16.6) | 68.8 (±19.7) | F(1,398) = 53.63, MSe = 56.17,p < .001, ηp2 = .119 | F(1,398) = 1.26, MSe = 56.17,p = .262, ηp2 = .003 |
| Group | 143 | 60.0 (±20.3) | 55.3 (±21.9) | |||
[i] * Participants that were only correct, or only incorrect during all practice trials were removed from the analysis.