
Table 1
Corresponding mean, standard deviation, and range values for participant age and scores on intelligence tests and the social responsiveness questionnaire (standard deviations in parentheses). Data is split by Group.
| AGE (YEARS) | WASI | SRS-2 | ||||
|---|---|---|---|---|---|---|
| VOCABULARY | MATRIX REASONING | FULL IQ | ||||
| Neurotypical | Mean | 26(6) | 54(10) | 61(10) | 114(15) | 50(5) |
| Group | Range | 19–38 | 39–72 | 46–78 | 90–138 | 41–58 |
| Autism | Mean | 30(8) | 62(10) | 60(10) | 119(14) | 75(9) |
| Group | Range | 20–52 | 43–80 | 44–74 | 97–146 | 61–98 |

Figure 1
Example experimental trial sequence (not to scale). Participants’ task was to locate a specific color rectangular bar (in this example, blue) and indicate whether this bar was horizontally or vertically oriented. Before each search display, participants viewed one of three possible kinds of cue display: a) cue matched the color of the subsequent rectangular bar being searched for (Target Color Cue), b) cue color appeared in subsequent search display as a nontarget bar (Nontarget Color Cue), c) cue consisted of a color that never appeared in search displays at all (Irrelevant Color Cue). Color cues could either validly or invalidly predict the location of the upcoming target item.
Table 2
Median reaction time (RT) in milliseconds and mean error rate (percentage incorrect trials) across Cue Type and Cue Validity conditions (standard deviations in parentheses). Data is presented overall and split by Group.
| TARGET COLOR CUE | NONTARGET COLOR CUE | IRRELEVANT COLOR Cue | |||||
|---|---|---|---|---|---|---|---|
| CUE- INVALID | CUE- VALID | CUE- INVALID | CUE- VALID | CUE- INVALID | CUE- VALID | ||
| All participants | RT Error rate | 554 (59) 5 (5) | 501 (53) 3 (4) | 526 (55) 3 (3) | 532 (61) 3 (4) | 531 (56) 4 (4) | 541 (62) 4 (5) |
| Neurotypical Group | RT Error rate | 534 (54) 4 (5) | 483 (50) 2 (3) | 508 (51) 3 (2) | 509 (56) 3 (4) | 512 (54) 3 (2) | 519 (60) 2 (2) |
| AutismGroup | RT Error rate | 575 (59) 6 (6) | 519 (51) 3 (5) | 545 (53) 4 (4) | 555 (59) 4 (4) | 551 (53) 4 (5) | 563 (58) 5 (6) |
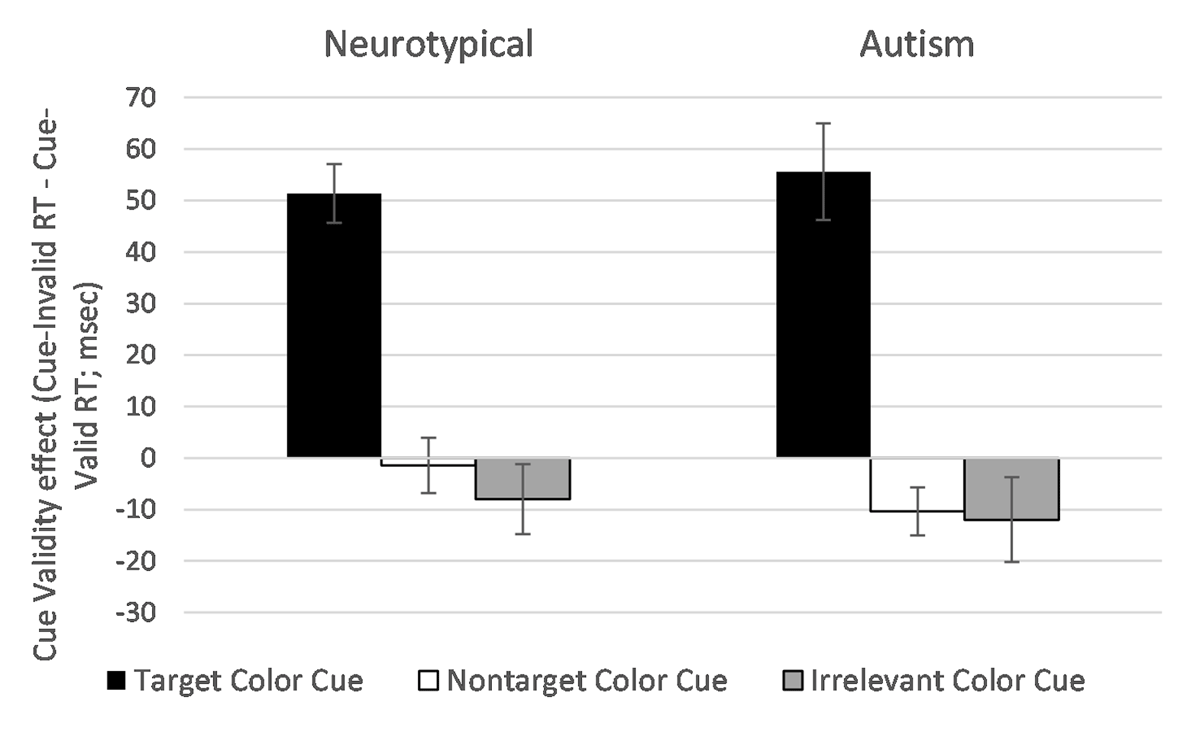
Figure 2
Cue validity effects on reaction time (calculated as Cue-Invalid minus Cue-Valid RT in milliseconds) across each Cue Type condition, separately for neurotypical and autism groups.