
Table 1
Descriptive statistics for response times, error rates and IES for single conditions of the six inhibitory control tasks.
| VARIABLE | M | SD | RANGE |
|---|---|---|---|
| Response Times | |||
| Stroop RTincon | 655.07 | 119.96 | 445.60 to 1033.06 |
| Stroop RTcon | 607.02 | 95.78 | 456.00 to 899.64 |
| Antisaccade RT | 457.87 | 127.01 | 239.85 to 1031.01 |
| Stop-signal RTgo | 641.96 | 85.24 | 471.20 to 893.03 |
| Flanker RTincom | 593.88 | 105.57 | 338.74 to 935.57 |
| Flanker RTno-noise | 552.69 | 90.85 | 339.15 to 862.20 |
| Shape-matching RTdis | 974.07 | 209.74 | 659.41 to 1700.01 |
| Shape-matching RTno-dis | 808.95 | 121.84 | 598.48 to 1253.49 |
| Word-naming RTdis | 388.76 | 76.80 | 288.56 to 727.25 |
| Word-naming RTno-dis | 363.54 | 74.32 | 263.64 to 697.33 |
| Error Rates | |||
| Stroop err%inc | 0.04 | 0.08 | 0.00 to 0.93 |
| Stroop err%con | 0.05 | 0.06 | 0.00 to 0.61 |
| Antisaccade err% | 0.16 | 0.13 | 0.00 to 0.66 |
| Stop-signal err%stop | 0.61 | 0.19 | 0.00 to 1.00 |
| Flanker err%incom | 0.08 | 0.11 | 0.00 to 0.50 |
| Flanker err%no-noise | 0.06 | 0.11 | 0.00 to 0.50 |
| Shape-matching err%dis | 0.06 | 0.10 | 0.00 to 0.88 |
| Shape-matching err%no-dis | 0.05 | 0.07 | 0.00 to 0.93 |
| Word-naming err%dis | 0.34 | 0.19 | 0.04 to 1.00 |
| Word-naming err%no-dis | 0.22 | 0.19 | 0.00 to 1.00 |
| Inverse Efficiency Scores | |||
| Stroop IESincon | 752.06 | 967.26 | 460.48 to 13872.47 |
| Stroop IEScon | 690.62 | 803.10 | 466.25 to 11576.93 |
| Flanker IESincom | 661.97 | 214.50 | 447.38 to 1871.15 |
| Flanker IESno-noise | 606.84 | 198.21 | 402.38 to 1724.41 |
| Shape-matching IESdis | 1091.97 | 584.52 | 740.63 to 7199.81 |
| Shape-matching IESno-dis | 886.55 | 578.91 | 619.58 to 8641.50 |
| Word-naming IESdis | 635.28 | 365.03 | 365.80 to 4751.04 |
| Word-naming IESno-dis | 485.92 | 209.79 | 323.24 to 2302.86 |
[i] Note: RT = reaction time; err% = error rate (in percent); IES = inverse efficiency score; incon = incongruent; con = congruent; incom = incompatible; dis = distractor; no-dis = no distractor trials. Given that the stop signal reaction time (SSRT) already accounts for speed and accuracy, no IES were computed.
Table 2
Descriptive statistics for the RT and IES outcome measures of the six inhibitory control tasks.
| MEASURE | M | SD | RANGE | SKEW | KURT | REL |
|---|---|---|---|---|---|---|
| RT | ||||||
| Response inhibition | ||||||
| Antisaccade (%) | 14.37 | 11.32 | 0 to 59 | 1.74 | 3.86 | .93 |
| Stroop effect (ms) | 47.52 | 51.52 | –58 to 223 | 0.70 | 0.24 | .61 |
| Stop-signal RT (ms) | 321.62 | 42.57 | 200 to 437 | 0.30 | -0.08 | .64 |
| Distractor Interference | ||||||
| Flanker effect (ms) | 47.06 | 38.72 | –69 to 177 | 0.61 | 3.07 | .47 |
| Shape effect (ms) | 160.04 | 113.02 | –11 to 638 | 2.40 | 7.02 | .98 |
| Word effect (ms) | 25.23 | 26.90 | –80 to 136 | 0.59 | 3.22 | .31 |
| IES | ||||||
| Response Inhibition | ||||||
| Antisaccade (ms) | 570.3 | 284.7 | 292 to 2651 | 4.14 | 23.05 | – |
| Stroop (ms) | 49.6 | 52.6 | –60 to 201 | 0.67 | -0.06 | – |
| Stop-signal (SSRT)° | 321.6 | 42.6 | 200 to 437 | 0.30 | -0.08 | – |
| Distractor Interference | ||||||
| Flanker (ms) | 51.3 | 59.6 | –96 to 319 | 0.93 | 2.78 | – |
| Shape-matching (ms) | 163.3 | 96.0 | –46 to 529 | 1.19 | 1.69 | – |
| Word-naming (ms) | 131.1 | 91.3 | –132 to 425 | 0.54 | 0.60 | – |
[i] Note: RT = reaction time; IES = inverse efficiency scores; % = percent incorrect; Skew = skewness; Kurt = excess kurtosis; Rel = reliability calculated as internal consistency by adjusting split-half correlations with the Spearman-Brown formula; °given that the stop signal reaction time (SSRT) already accounts for speed and accuracy, no IES were computed.
Table 3
Inter-correlations of reaction times and error rates for the six inhibitory control tasks.
| Variable | 1 | 2 | 3 | 4 | 5 | 6 | 7 | 8 | 9 | 10 | 11 |
|---|---|---|---|---|---|---|---|---|---|---|---|
| 1 Stroop RT | — | ||||||||||
| 2 Antisaccade RT | .36*** | — | |||||||||
| 3 Stop-signal RT | .26*** | .21** | — | ||||||||
| 4 Flanker RT | .61*** | .48*** | .29*** | — | |||||||
| 5 Shape-matching RT | .61*** | .48*** | .18* | .55*** | — | ||||||
| 6 Word-naming RT | .18* | .10 | .13° | .16* | .17* | — | |||||
| 7 Stroop err% | .03 | –.123° | –.18* | –.13° | –.13° | –.02 | — | ||||
| 8 Antisaccade err% | .03 | .38*** | –.03 | .14* | .13° | –.02 | .18* | — | |||
| 9 Stop-signal err% | –.14° | –.08 | –.90*** | –.17* | –.04 | –.11 | .15* | .09 | — | ||
| 10 Flanker err% | –.19* | –.07 | –.10 | –.15* | –.15* | –.06 | .21** | .25** | .13° | — | |
| 11 Shape-matching err% | –.17* | –.17* | –.08 | –.16* | –.20** | .01 | .29*** | .19** | .07 | .19** | — |
| 12 Word-naming err% | .12° | .11 | –.13° | .12° | .16* | –.39*** | .02 | .27*** | .16* | .04 | .05 |
[i] Note: RT = mean reaction time; err% = error rate (in percent) in stop/distractor/incongruent trials; ° p < .10; * p < .05; ** p < .01; *** p < .001.
Table 4
Spearman correlations of the six inhibitory control tasks for RT scores and IES.
| 1 | 2 | 3 | 4 | 5 | ||||||
|---|---|---|---|---|---|---|---|---|---|---|
| RTa | IES | RT | IES | RT | IES | RT | IES | RT | IES | |
| 1 Antisaccade | ||||||||||
| 2 Stroop | .07 | .11 | ||||||||
| 3 Stop-signal | .16* | .19** | .13 | .13 | ||||||
| 4 Flanker | –.03 | –.02 | .03 | .10 | –.05 | –.11 | ||||
| 5 Shape-matching | .12 | .18* | .29*** | .21** | –.06 | –.08 | .14 | .06 | ||
| 6 Word-naming | .00 | .18* | .05 | .03 | –.07 | .13 | .05 | .11 | .01 | .11 |
[i] Note: RT indicates correlations between reaction time measures with the exception of a where error rates in percent in the antisaccade task were correlated with reaction time measures in the other tasks; IES indicates correlations between inverse efficiency scores. Correlations between RT and IES are not shown. * p < .05; ** p < .01; *** p < .001.
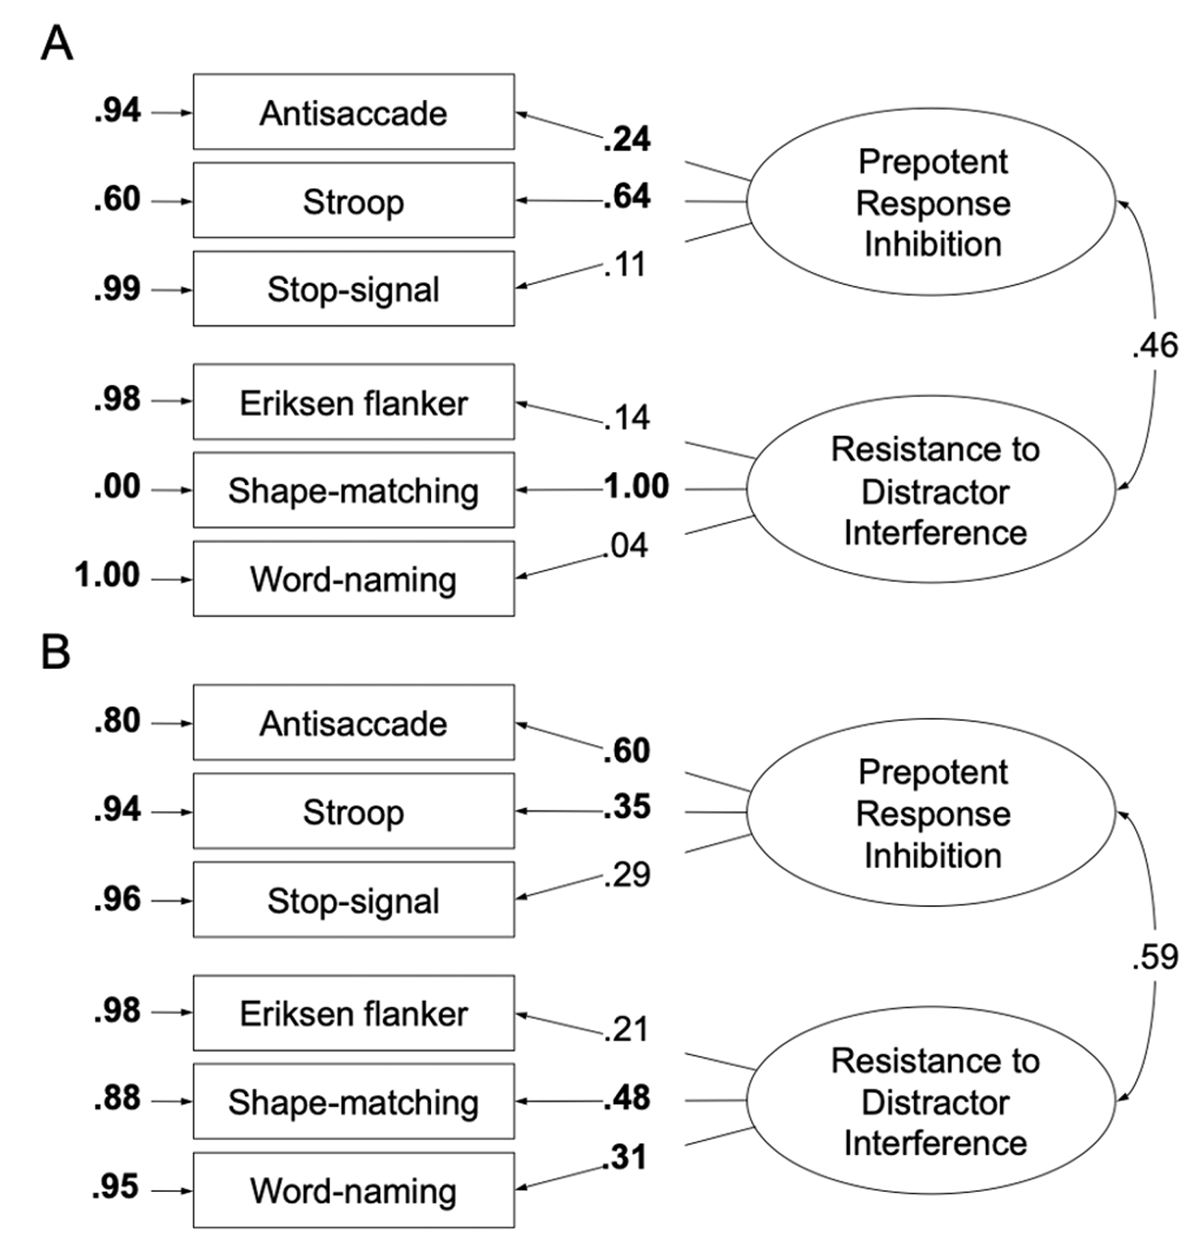
Figure 1
The two-factor model of inhibition-related functions using RT scores (A) and inverse efficiency scores (B), completely standardized solution. Numbers on the leftwards single-headed arrows are standardized factor loadings. Numbers on the rightwards smaller arrows depict error variances for each task, attributable to idiosyncratic task requirements and measurement error. The number on the curved double-headed arrow is the correlation between the latent variables. Bold-face type indicates significance at the .05 level.
Table 5
Fit statistics for the confirmatory factor analysis models.
| Model | df | x2 | RMSEA | SRMR | CFI | AIC | NFI |
|---|---|---|---|---|---|---|---|
| Reaction time scores | |||||||
| Null model | 15 | 40.12*** | .094 | .090 | .000 | 64.115 | .000 |
| Two factors unrelated | 9 | 26.48** | .101 | .079 | .304 | 62.476 | .340 |
| Two factors related | 8 | 12.65 | .055 | .053 | .815 | 50.645 | .685 |
| One factor | 9 | 15.34 | .061 | .057 | .748 | 51.340 | .618 |
| Inverse efficiency scores | |||||||
| Two factors unrelated | 9 | 19.71* | .079 | .074 | .619 | 55.707 | .543 |
| Two factors related | 8 | 11.62 | .049 | .049 | .871 | 49.623 | .730 |
| One factor | 9 | 14.03 | .054 | .041 | .821 | 50.030 | .674 |
[i] Note: Reasonable fit: Chi-squares not significant at the .05 level; lower values of root mean square error of approximation (RMSEA) with <.08 mediocre fit, <.05 good fit and <.01 excellent fit; lower values of standardized root-mean-square residual (SRMR) with <.08 fair fit, <.05 good fit; values above .95 for Bentler’s comparative fit index (CFI) for excellent fit; lower values of Akaike’s information criterion (AIC); values above .95 for the normed fit index (NFI) for good fit * p < .05.
Supplementary Table A1
Factor loadings and bootstrapped estimates for the respective models.
| MODEL | STANDARDIZED FACTOR LOADING° | MEAN STANDARDIZED FACTOR LOADING | BIAS | SE | p |
|---|---|---|---|---|---|
| Two factors, related (reaction time scores) | |||||
| Antisaccade ← response inhibition | .239 | .238 | .000 | .18 | .046 |
| Stroop ← response inhibition | .635 | .662 | .027 | .27 | .001 |
| Stop-signal ← response inhibition | .112 | .138 | .025 | .14 | .583 |
| Eriksen flanker ← distractor interference | .142 | .149 | .149 | .10 | .111 |
| Shape-matching ← distractor interference | 1.00 | .947 | .947 | .16 | <.001 |
| Word-naming ← distractor interference | .038 | .036 | .036 | .13 | .619 |
| One factor, 4 tasks (inverse efficiency scores) | |||||
| Antisaccade ← response distractor interference | .417 | .417 | .000 | .16 | .001 |
| Stroop ← response distractor interference | .394 | .382 | –.013 | .15 | .007 |
| Shape-matching ← response distractor interference | .476 | .508 | .033 | .18 | .002 |
| Word-naming ← response distractor interference | .212 | .214 | .002 | .13 | .044 |
[i] Note: ° without bootstrap; Bias: difference between original estimate and bootstrap mean estimate; bootstrap with N = 5000.