

Figure 1
Example of a congruent Stroop trial followed by a target-absent trial. The target was a 1.4 cm long green line, slanted at 45°.
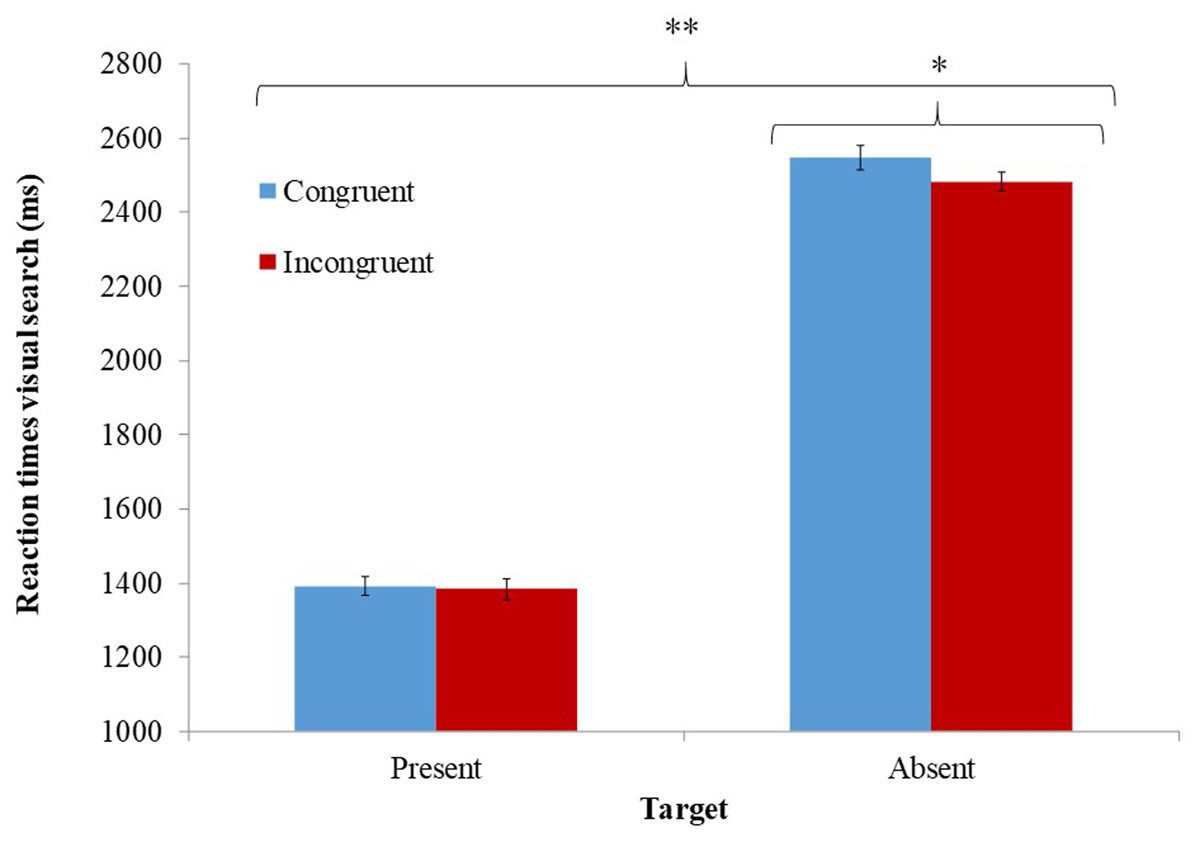
Figure 2
Mean RT in the different conditions of the visual search task as a function of the different inhibitory control conditions. * Significant at p < .05 levels. ** Significant at p < .0001 levels. Error bars represent ± 1 standard error (Cousineau, 2005).
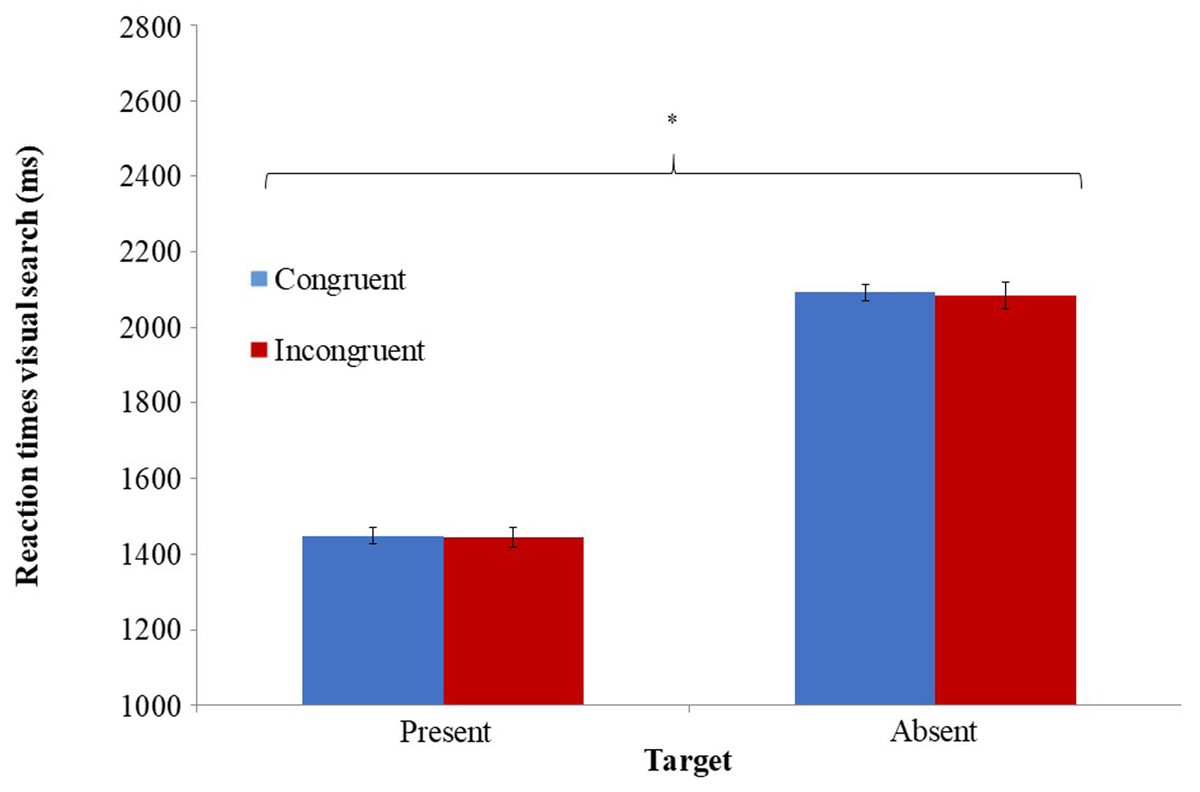
Figure 3
Mean RT in the different conditions of the visual search task as a function of the different inhibitory control conditions. * Significant at p < .0001 levels. Error bars represent ± 1 standard error (Cousineau, 2005).
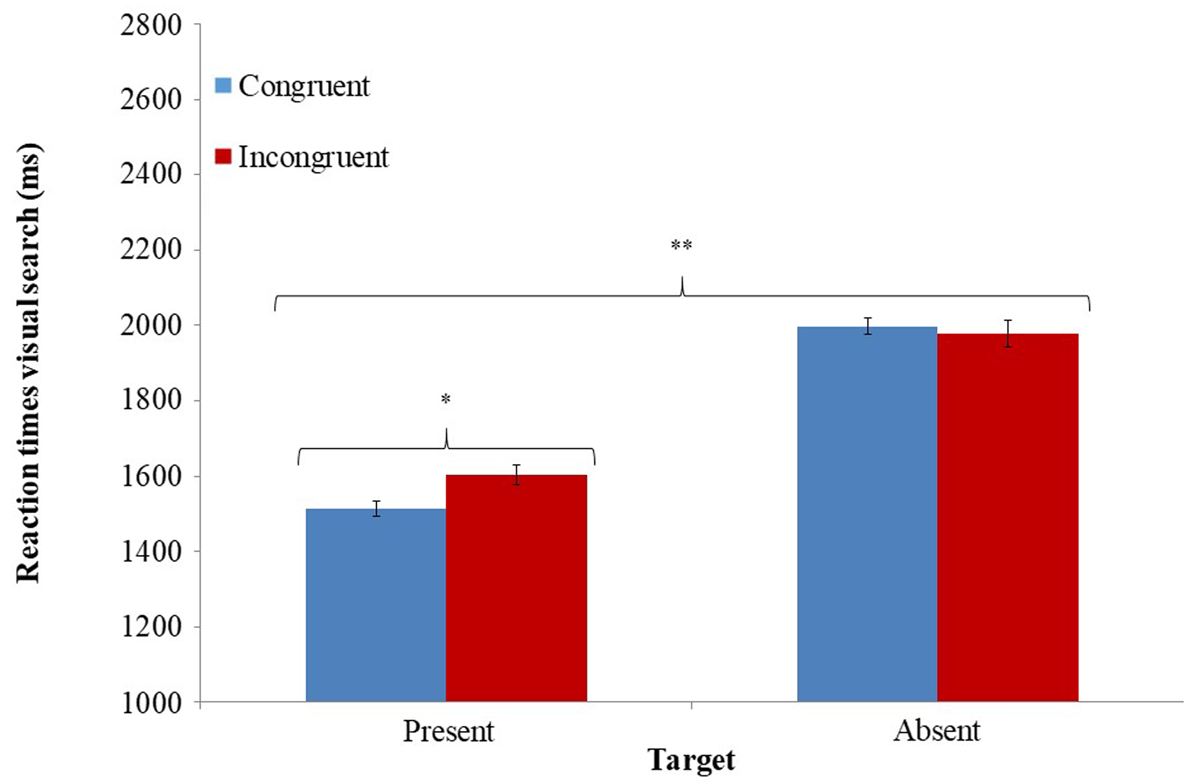
Figure 4
Mean RT in the different conditions of the visual search task as a function of the different inhibitory control conditions. * Significant at p < .005 levels; ** Significant at p < .0001. Error bars represent ± 1 standard error (Cousineau, 2005).