
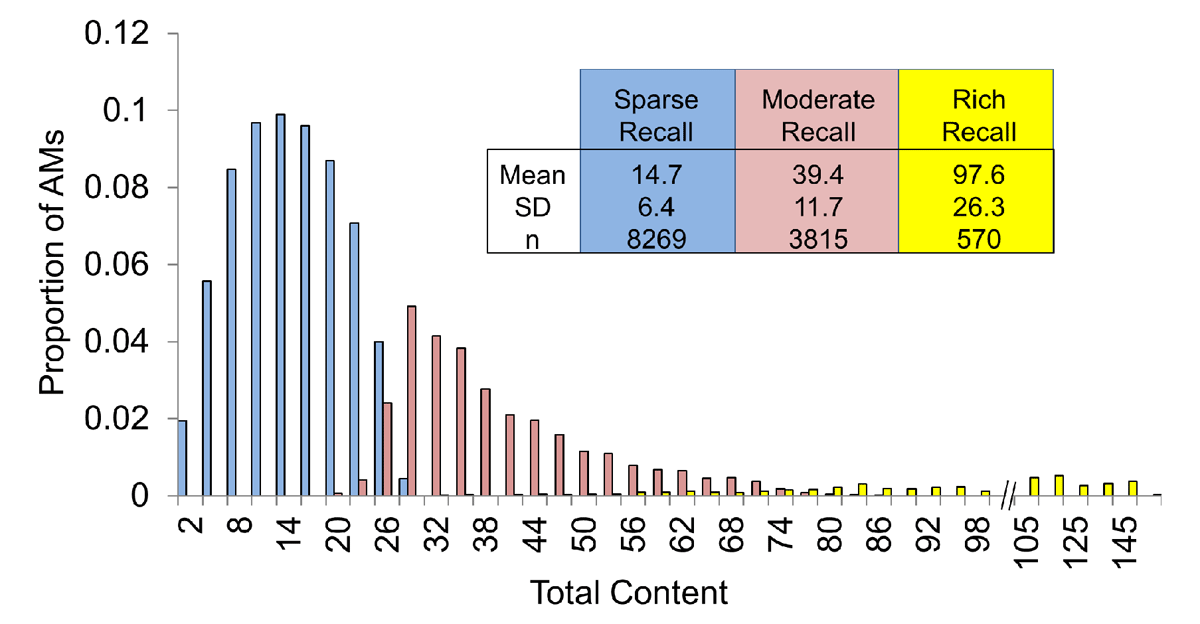
Figure 1
Cluster analysis of feature counts distinguishes between AMs based on the total amount of detail they contain. Two-step unsupervised cluster analysis of feature counts identified three distinct classes of AMs: 1) those associated with relatively little content (sparse recall), 2) those with a moderate amount of content (moderate recall), and 3) those relatively rich with content (rich recall). Histograms highlight the distribution of total content scores for AMs within each cluster.
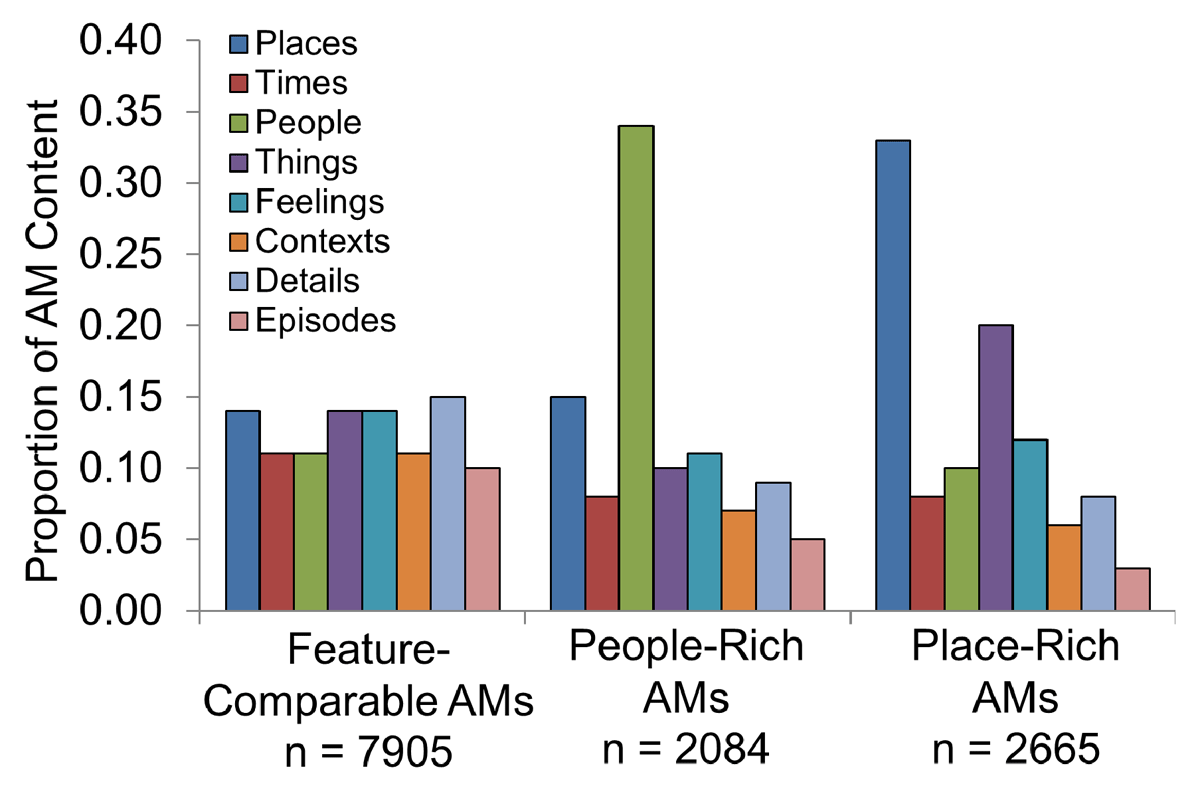
Figure 2
Analysis of feature contributions to total content reveals unique clusters. A k-means clustering algorithm (k = 3) produced groups characterized by AMs with comparable feature composition, People-Rich AMs, and Place-Rich AMs.
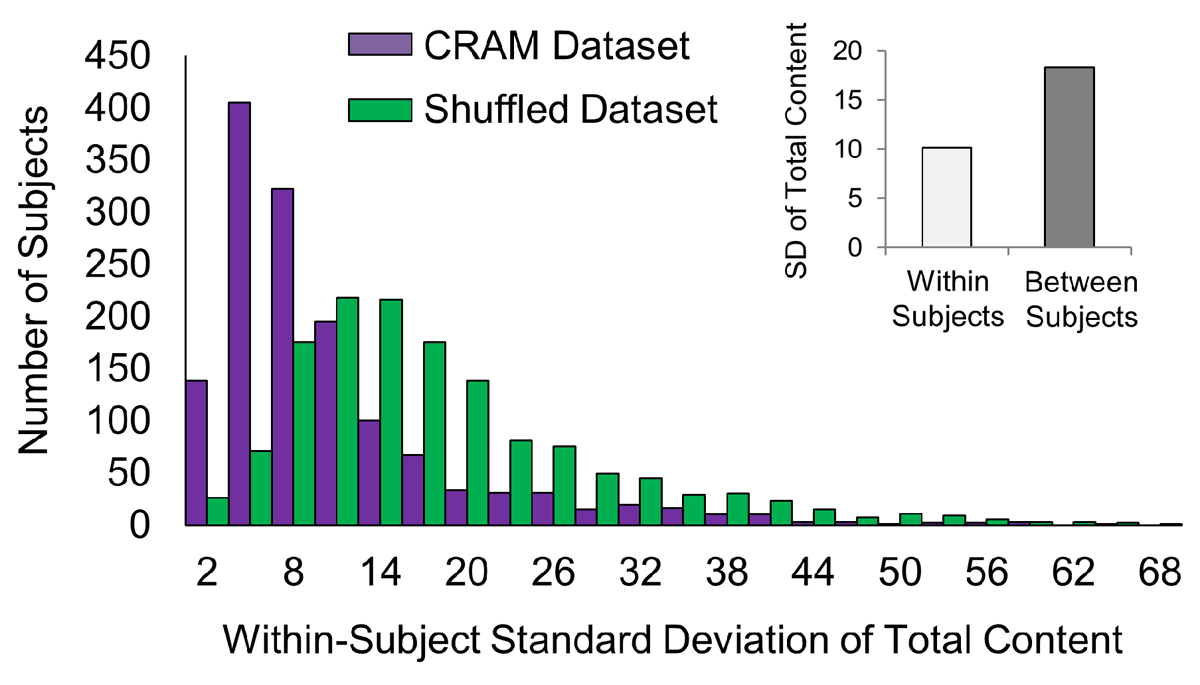
Figure 3
Within-subject variability in total reported content is less than that between subjects. Between-subject standard deviation was almost twice as large as that within-subjects (inset). To ensure the relatively low within-subject variability across AM content was not due to chance, AMs were shuffled and then randomly reassigned to individual subjects. Lower within-subject AM content variability was found in the original dataset compared with that in the shuffled dataset (mean SD = 10.1 vs. 17.7, respectively; p < 0.05). Histograms of the two datasets are presented. Number of subjects = 1,407; Number of AMs = 10,001.