
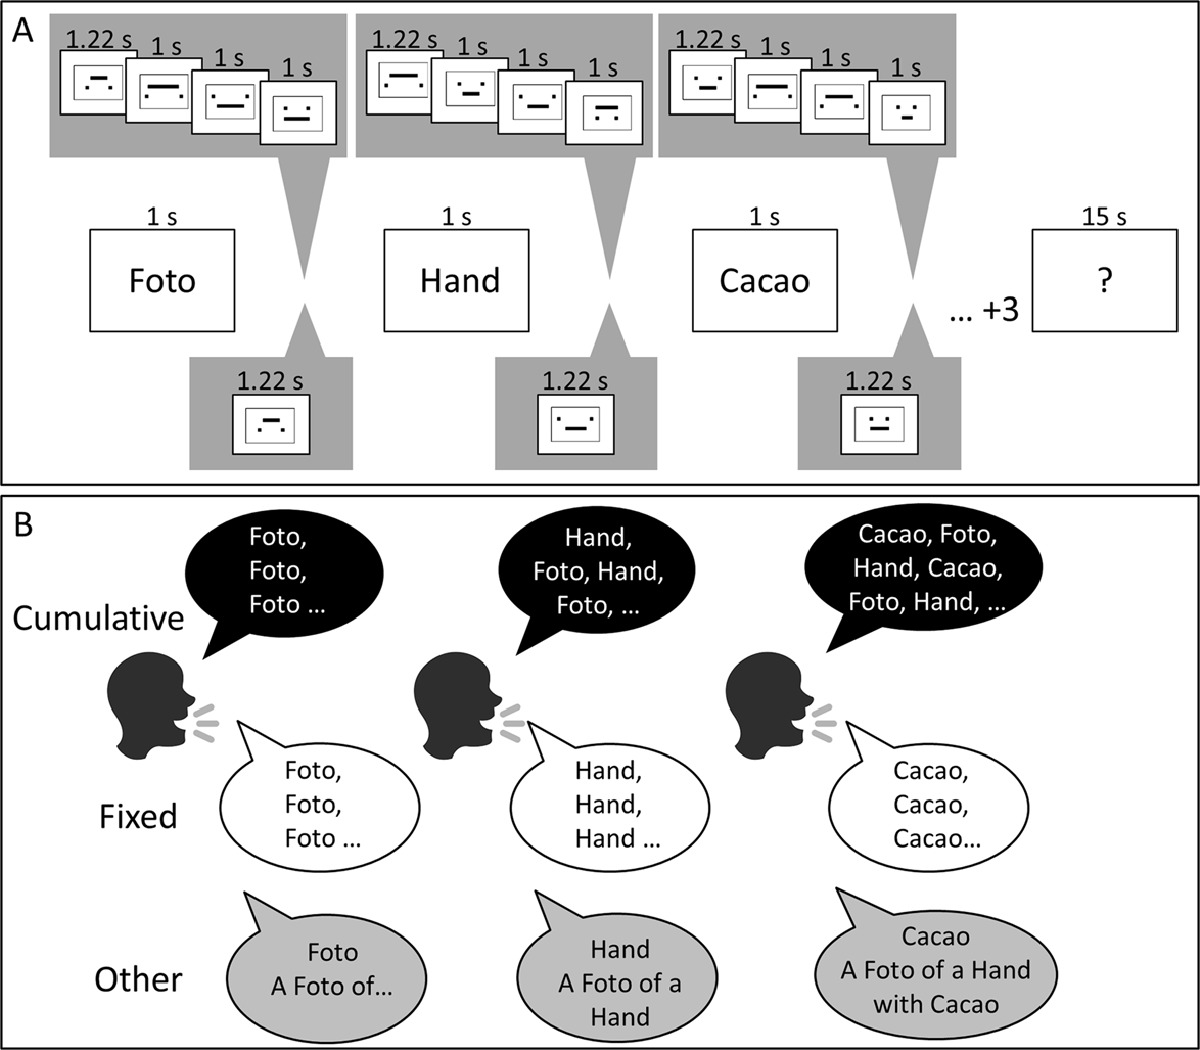
Figure 1
Panel A. Illustration of the flow of events in complex span trials with a slow (5.22 s between memory items, top row) and medium presentation-rate (2.22 s between memory items, bottom row). Panel B illustrates the classification of hypothetical rehearsal patterns into cumulative rehearsals, fixed rehearsals, and other.
Table 1
Performance in the Spatial Distractor Task for the Complex Span Groups in Experiment 1. Values in Bold Indicate the Evidence (Bayes Factor, BF) for the Alternative Hypothesis over the Null for the Difference in Performance Between the Two Groups.
| Rate | Rehearsal | Proportion Correct | Reaction Time (s) | CL | |||
|---|---|---|---|---|---|---|---|
| M | 95% CI | M | 95% CI | ||||
| Medium | Silent | 0.94 | [0.93, 0.95] | 0.622 | [0.616, 0.628] | 0.51 | |
| Overt | 0.92 | [0.91, 0.93] | 0.647 | [0.640, 0.655] | 0.53 | ||
| BF10 | 1.17 | 0.74 | 0.73 | ||||
| Slow | Silent | 0.91 | [0.90, 0.92] | 0.583 | [0.580, 0.587] | 0.54 | |
| Overt | 0.89 | [0.88, 0.90] | 0.604 | [0.600, 0.609] | 0.55 | ||
| BF10 | 0.70 | 0.98 | 0.44 | ||||
[i] Note: CI = 95% within-subjects confidence interval. CL = cognitive load.
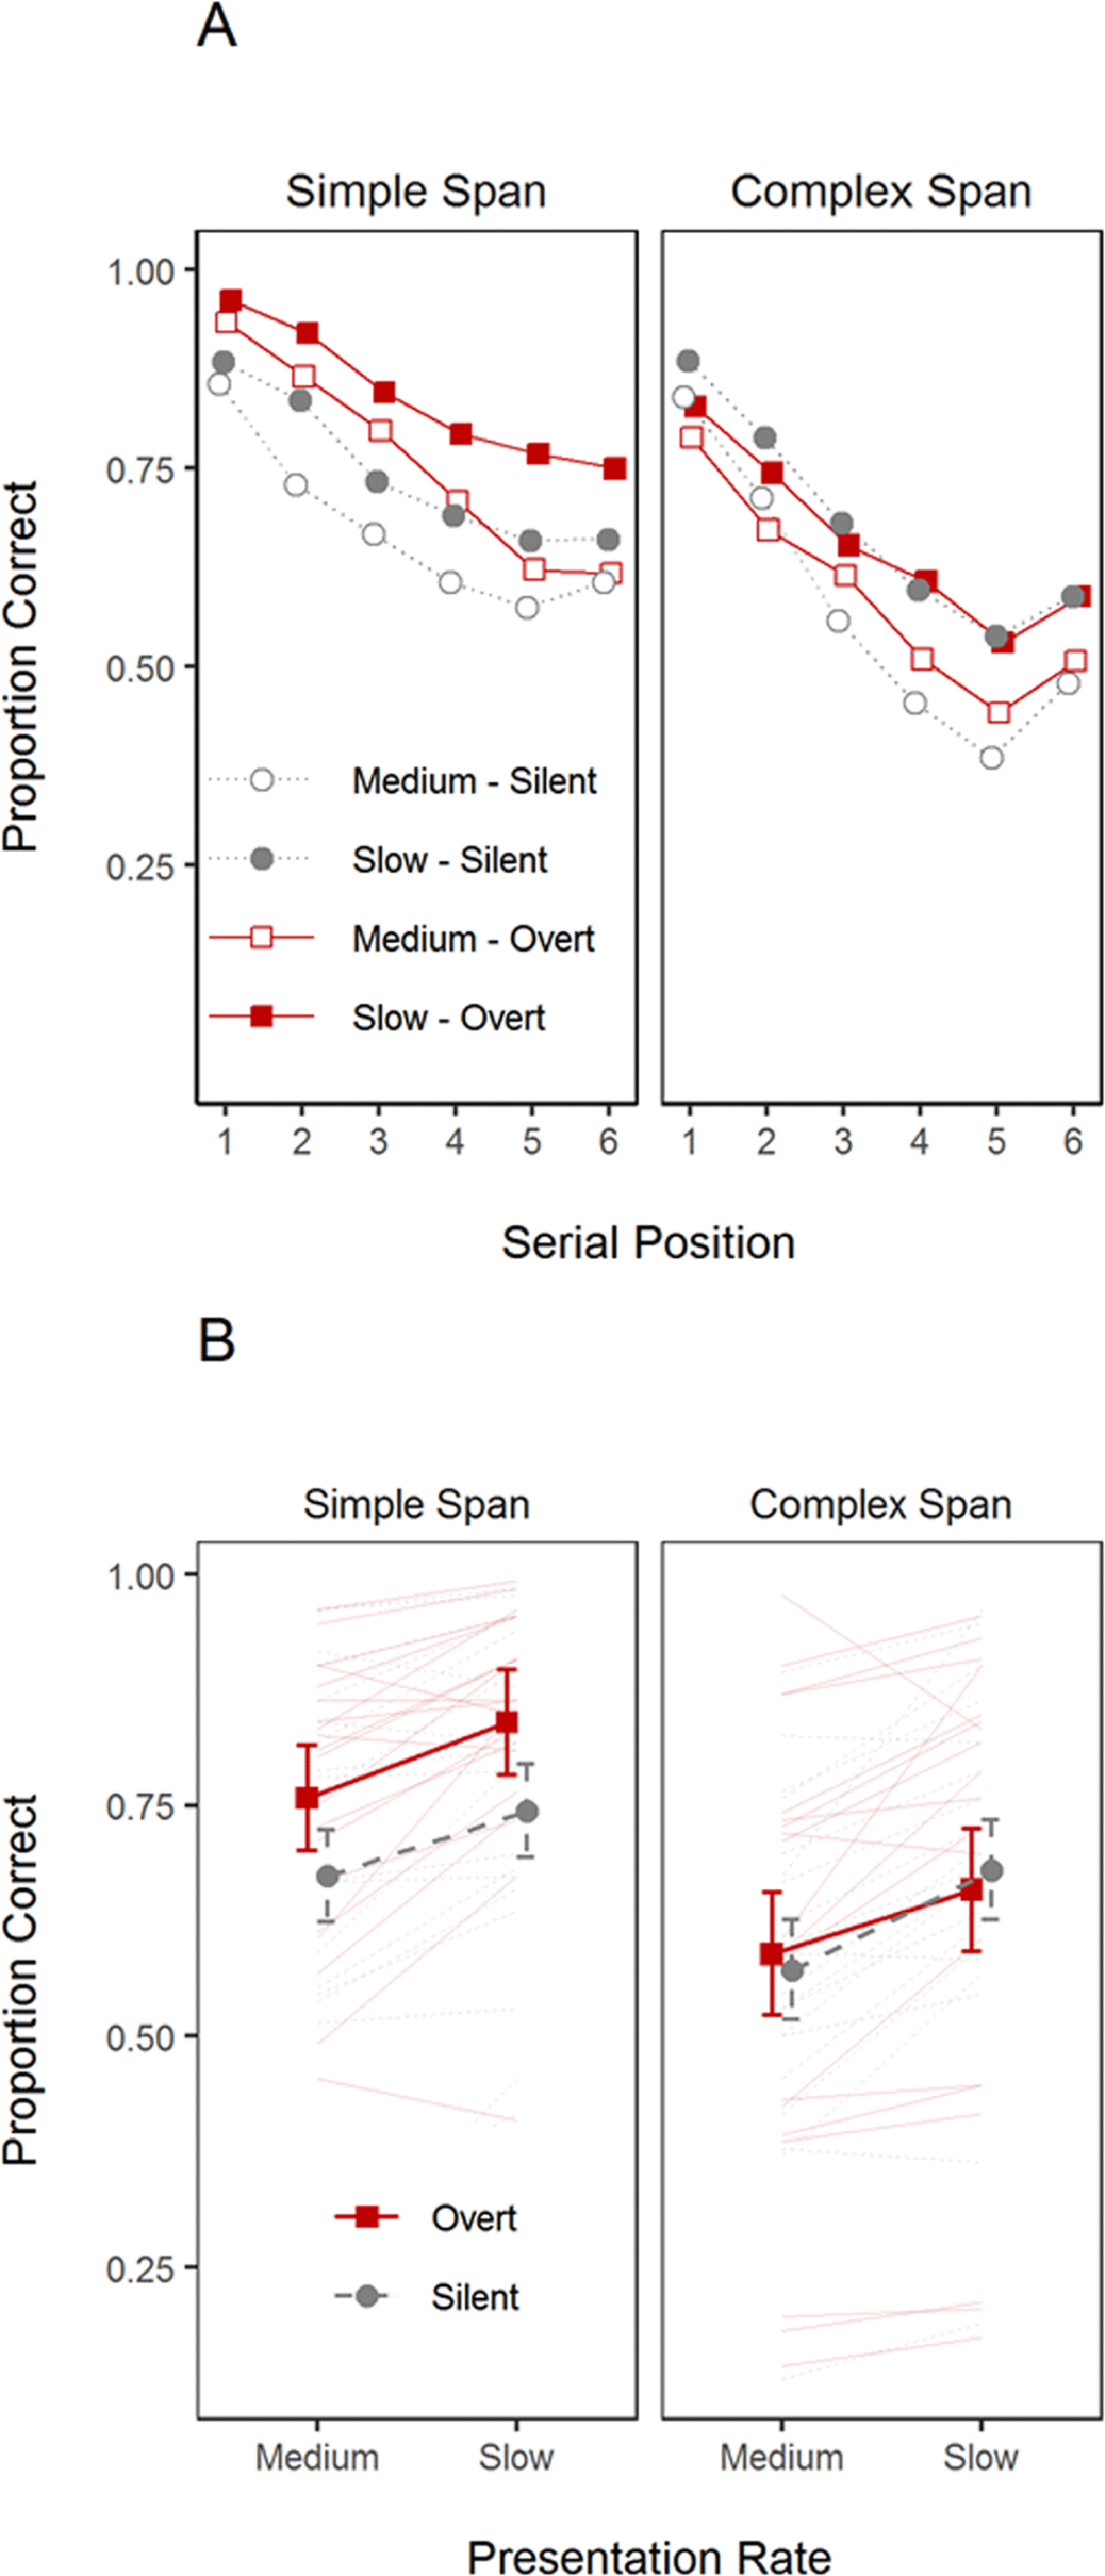
Figure 2
Panel A. Serial position curves for each span task and rehearsal instructions (between-subject variables), and presentation rate (within-subject variable) in Experiment 1. Panel B presents overall proportion of correct responses as a function of presentation rate, task, and rehearsal instruction. Faint lines represent individual participants. Error-bars correspond to the standard deviation.
Table 2
Bayes Factors Quantifying the Strength of Evidence for the Main Effects and Interactions of the Variables Manipulated in Experiment 1 on Serial-Recall Accuracy.
| Term | Simple Span | Complex Span |
|---|---|---|
| Overt Rehearsal Instruction | 1.06 | 0.56 |
| Rate | 84’650 | 91’111 |
| Serial Position | 7.53 × 1029 | 1.05 × 1032 |
| Overt Rehearsal × Rate | 0.25 | 0.59 |
| Overt Rehearsal × Serial Position | 0.11 | 0.21 |
| Rate × Serial Position | 2.14 | 1.01 |
| Three-way interaction | 0.66 | 0.06 |
[i] Note: The data of each span task was analyzed with different sets of models.
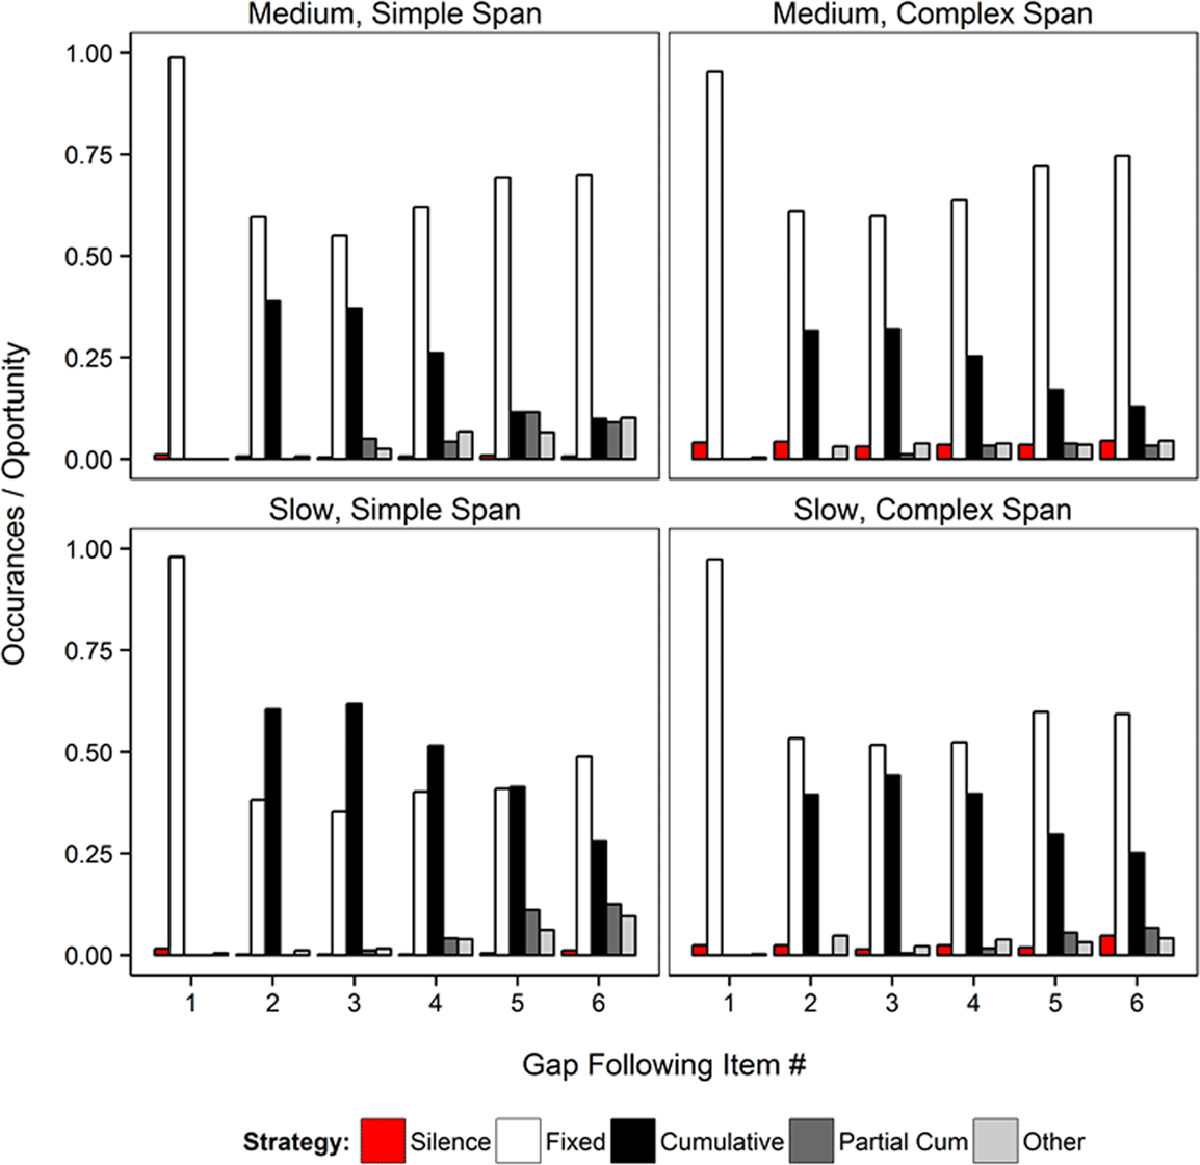
Figure 3
Relative frequency of each type of rehearsal strategy plotted separately for the overt simple span and overt complex span groups, and the medium and slow presentation rates in Experiment 1.
Table 3
Correlation Coefficients Between the Average Maximum Length of the Rehearsal Sequence and Recall Accuracy.
| Experiment | Group | Rate/Block | Pearson R |
|---|---|---|---|
| 1 | Simple Span | Medium | 0.373 |
| Slow | 0.394 | ||
| 1 | Complex Span | Medium | 0.672 |
| Slow | 0.748 |
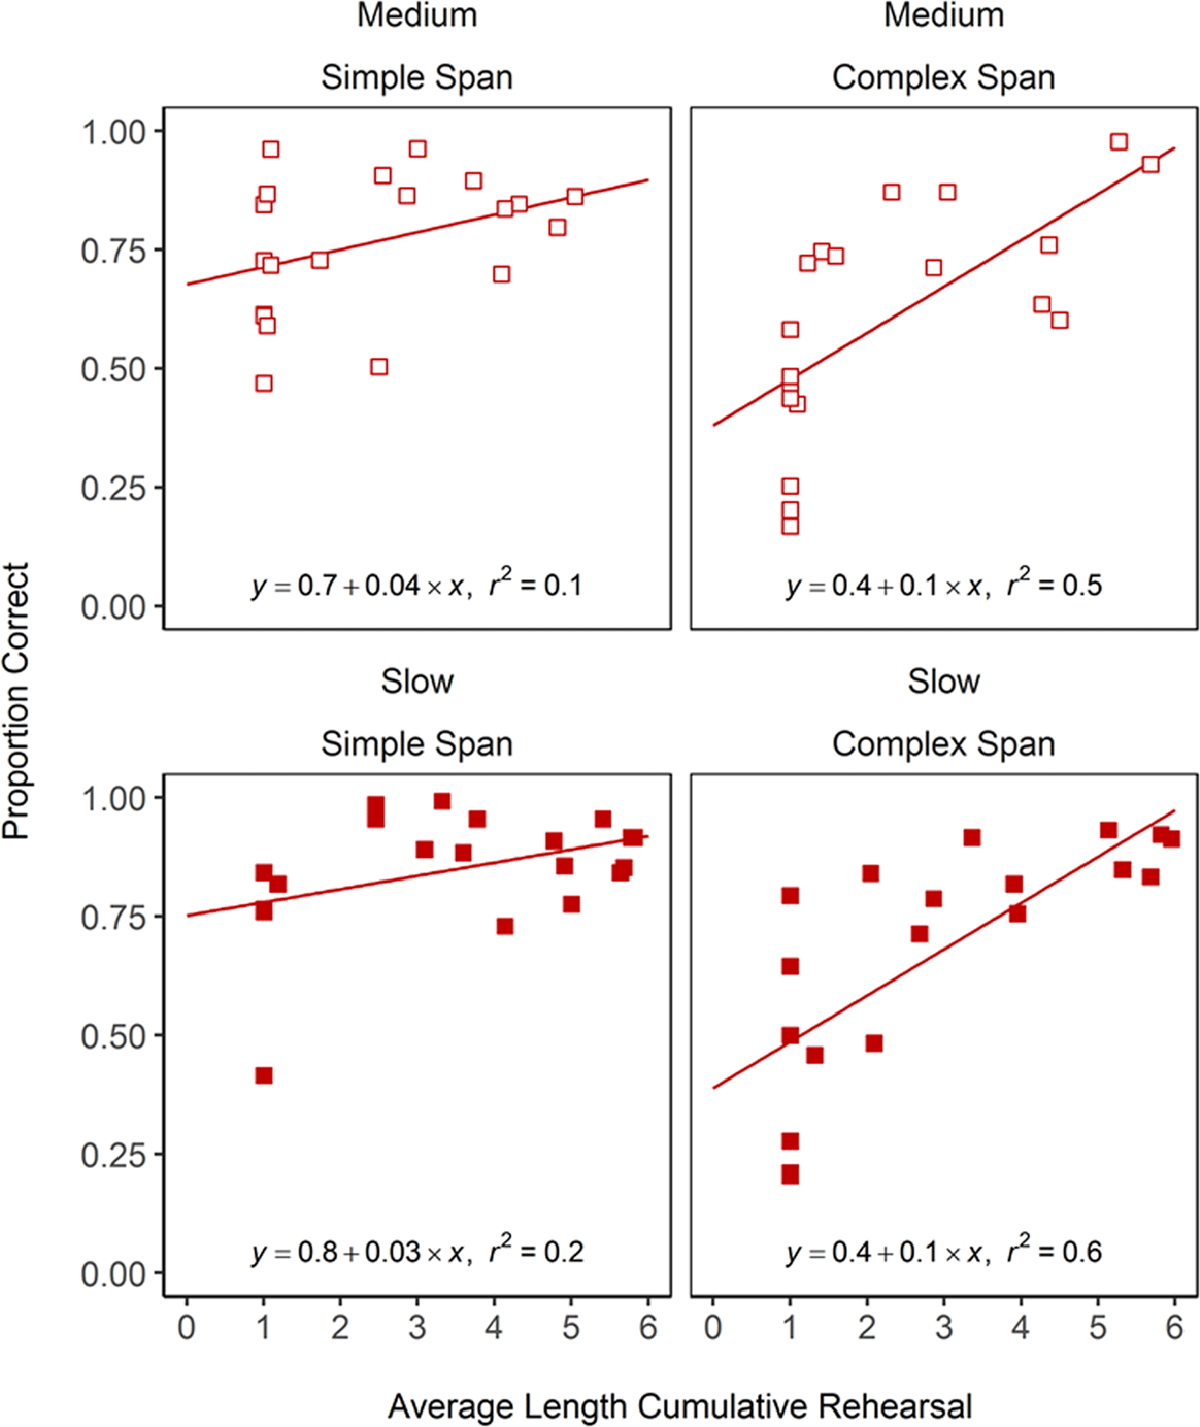
Figure 4
Scatterplots showing the relationship between cumulative rehearsal-sequence length against recall accuracy across participants in Experiment 1. The line and coefficients obtained when fitting a regression line to this data are shown inside each panel.
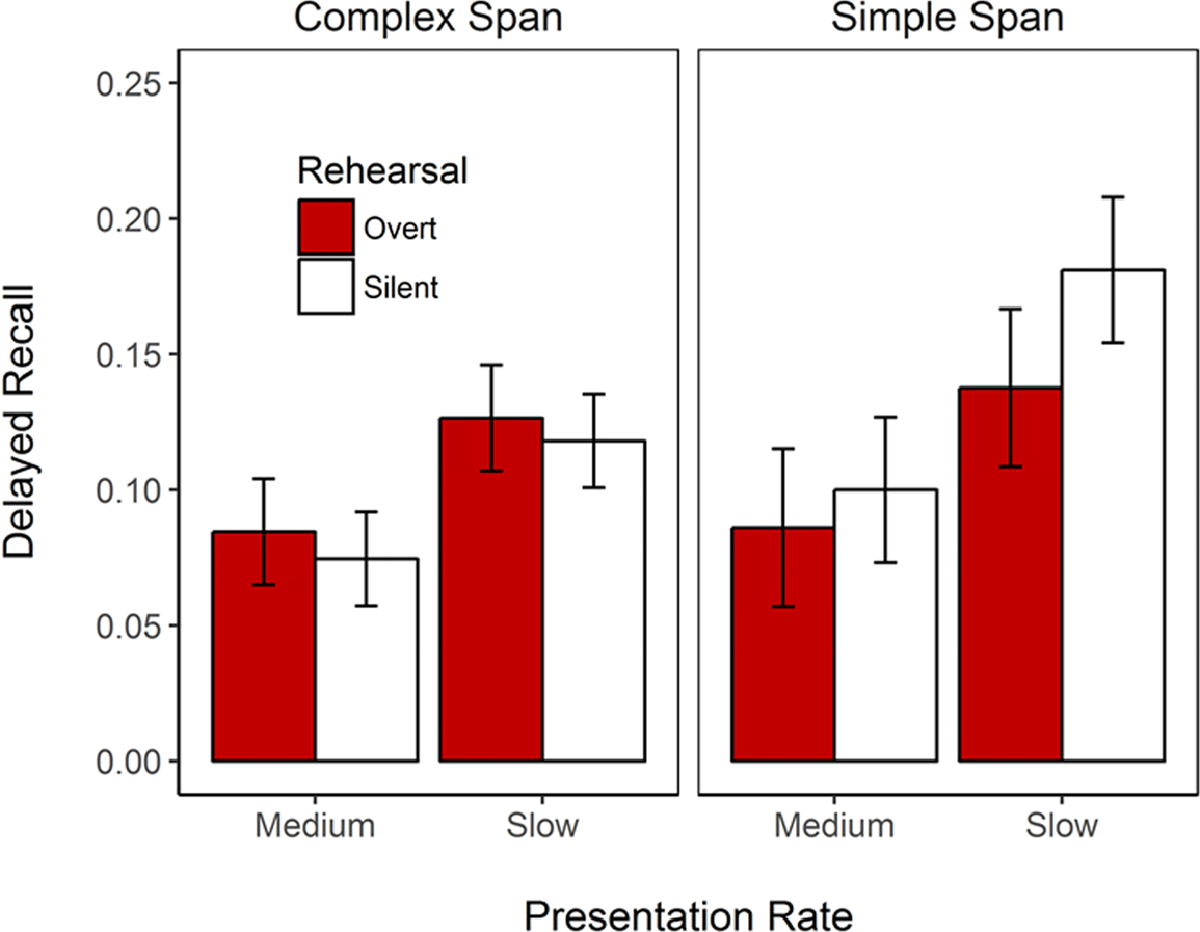
Figure 5
Proportion of words studied during fast and slow rate trials that were recalled in the surprise free recall test at the end of Experiment 1. Error bars represent 95% within-subjects confidence intervals.
Table 4
Performance on the Spatial Fit Task Used as Distractor Task in the Complex Span Blocks in Experiment 2 and Evidence (BF) for Group Differences.
| Block | Group | Proportion Correct | Reaction Time (s) | ||
|---|---|---|---|---|---|
| M | 95% CI | M | 95% CI | ||
| Pre-test | Control | 0.86 | [0.83, 0.90] | 0.609 | [0.581, 0.636] |
| Cumulative Reh. | 0.89 | [0.87, 0.91] | 0.601 | [0.580, 0.622] | |
| BF10 | 0.69 | 0.30 | |||
| Test | Control | 0.89 | [0.86, 0.91] | 0.585 | [0.562, 0.609] |
| Cumulative Reh. | 0.89 | [0.86, 0.92] | 0.599 | [0.578, 0.620] | |
| BF10 | 0.28 | 0.39 | |||
[i] Note: CI = 95% between-subjects confidence interval.
Table 5
Average Number of Rehearsed Words in Each Experimental Block in Experiment 2. The Evidence for the Difference in Rehearsal Between the Groups and the Blocks were Assessed with Bayesian T-Tests.
| Block | Control | Cumulative Rehearsal | Group | ||
|---|---|---|---|---|---|
| M | 95% CI | M | 95% CI | BF10 | |
| Pre-test | 20.4 | [14.5, 26.3] | 21.8 | [17.4, 26.2] | 0.29 |
| Training | 18.3 | [13.4, 23.2] | 38.1 | [34.4, 41.8] | 5.9 × 10⁵ |
| Test | 18.3 | [12.4, 24.2] | 36.9 | [32.4, 41.5] | 3718 |
| Pre-test vs. Test – BF10 | 0.34 | 4762.5 | |||
[i] Note: CI = 95% within-subjects confidence interval.
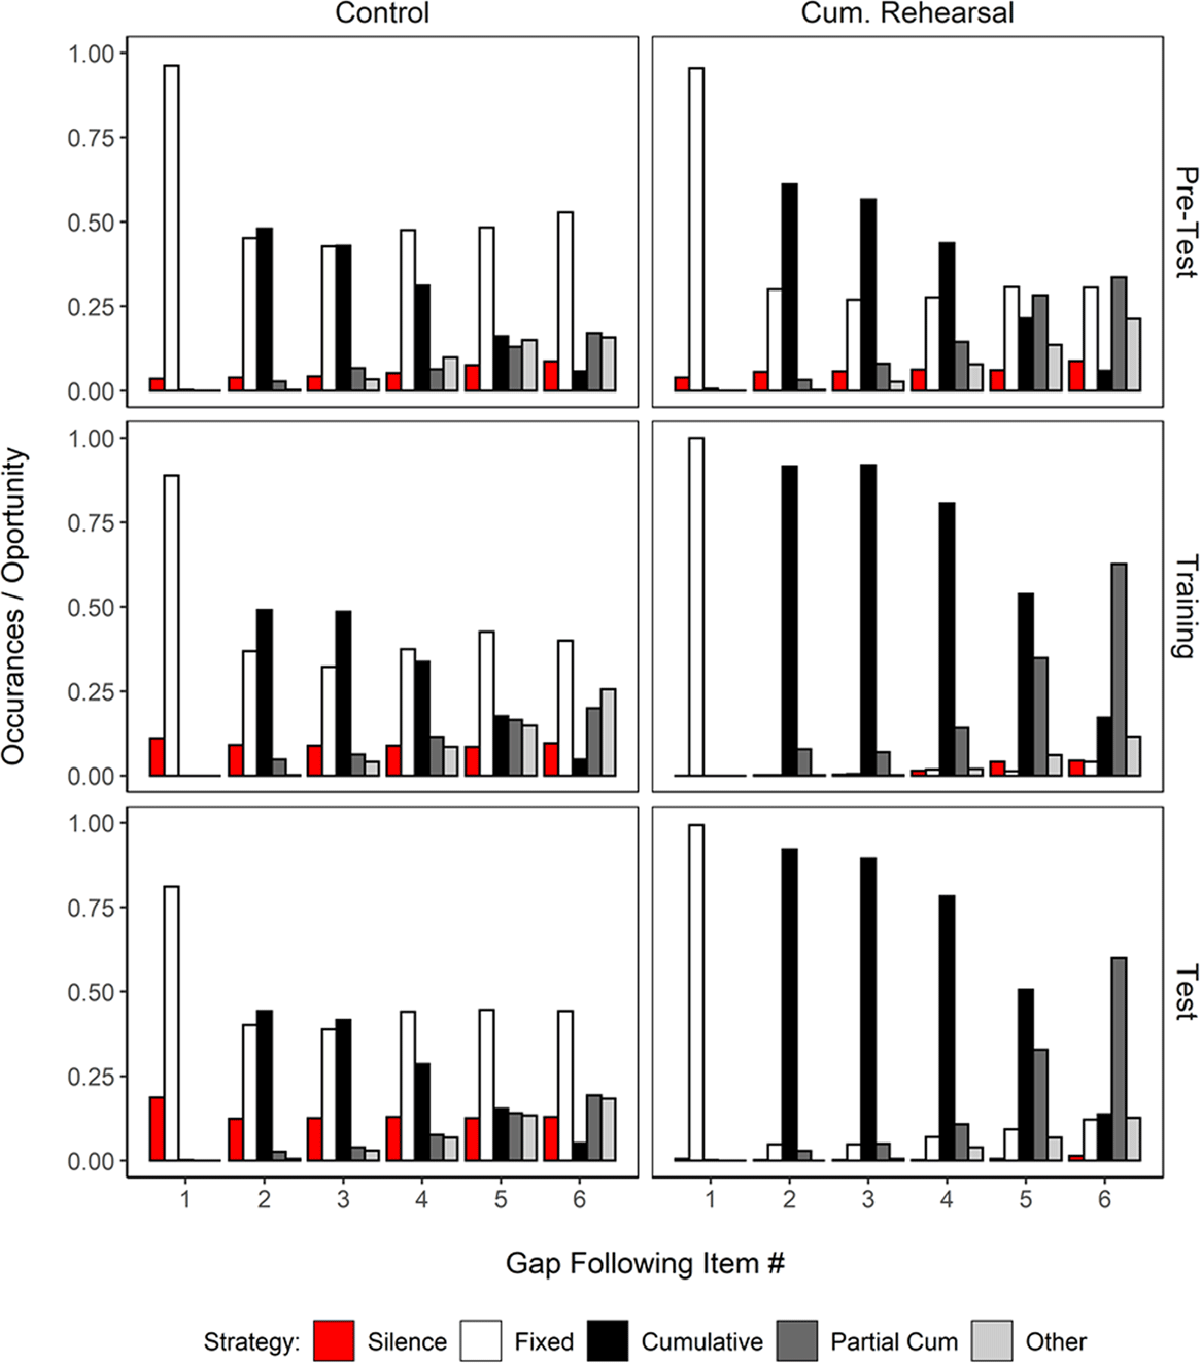
Figure 6
Relative frequency of each type of rehearsal strategy plotted separately for the three experimental blocks (Pre-test, Training, and Test) and two groups (Control vs Cumulative Rehearsal) in Experiment 2.
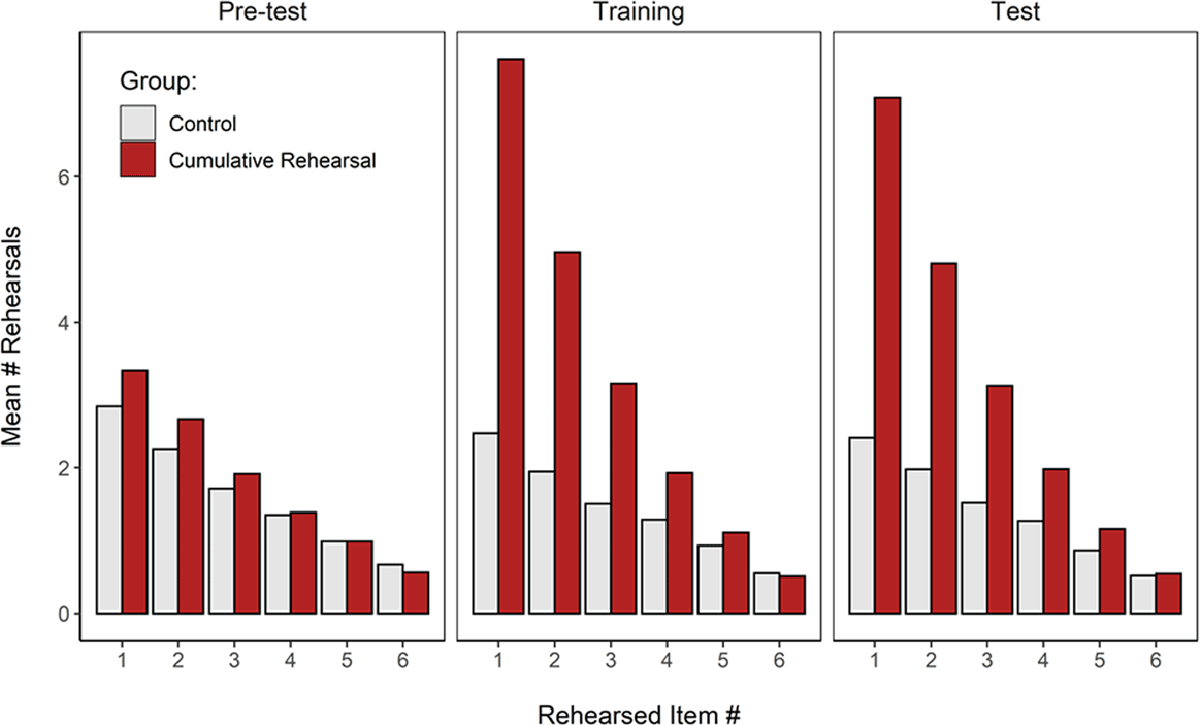
Figure 7
Average frequency of rehearsals of each list item during the trial plotted separately for the three experimental blocks of Experiment 2, and the two groups.
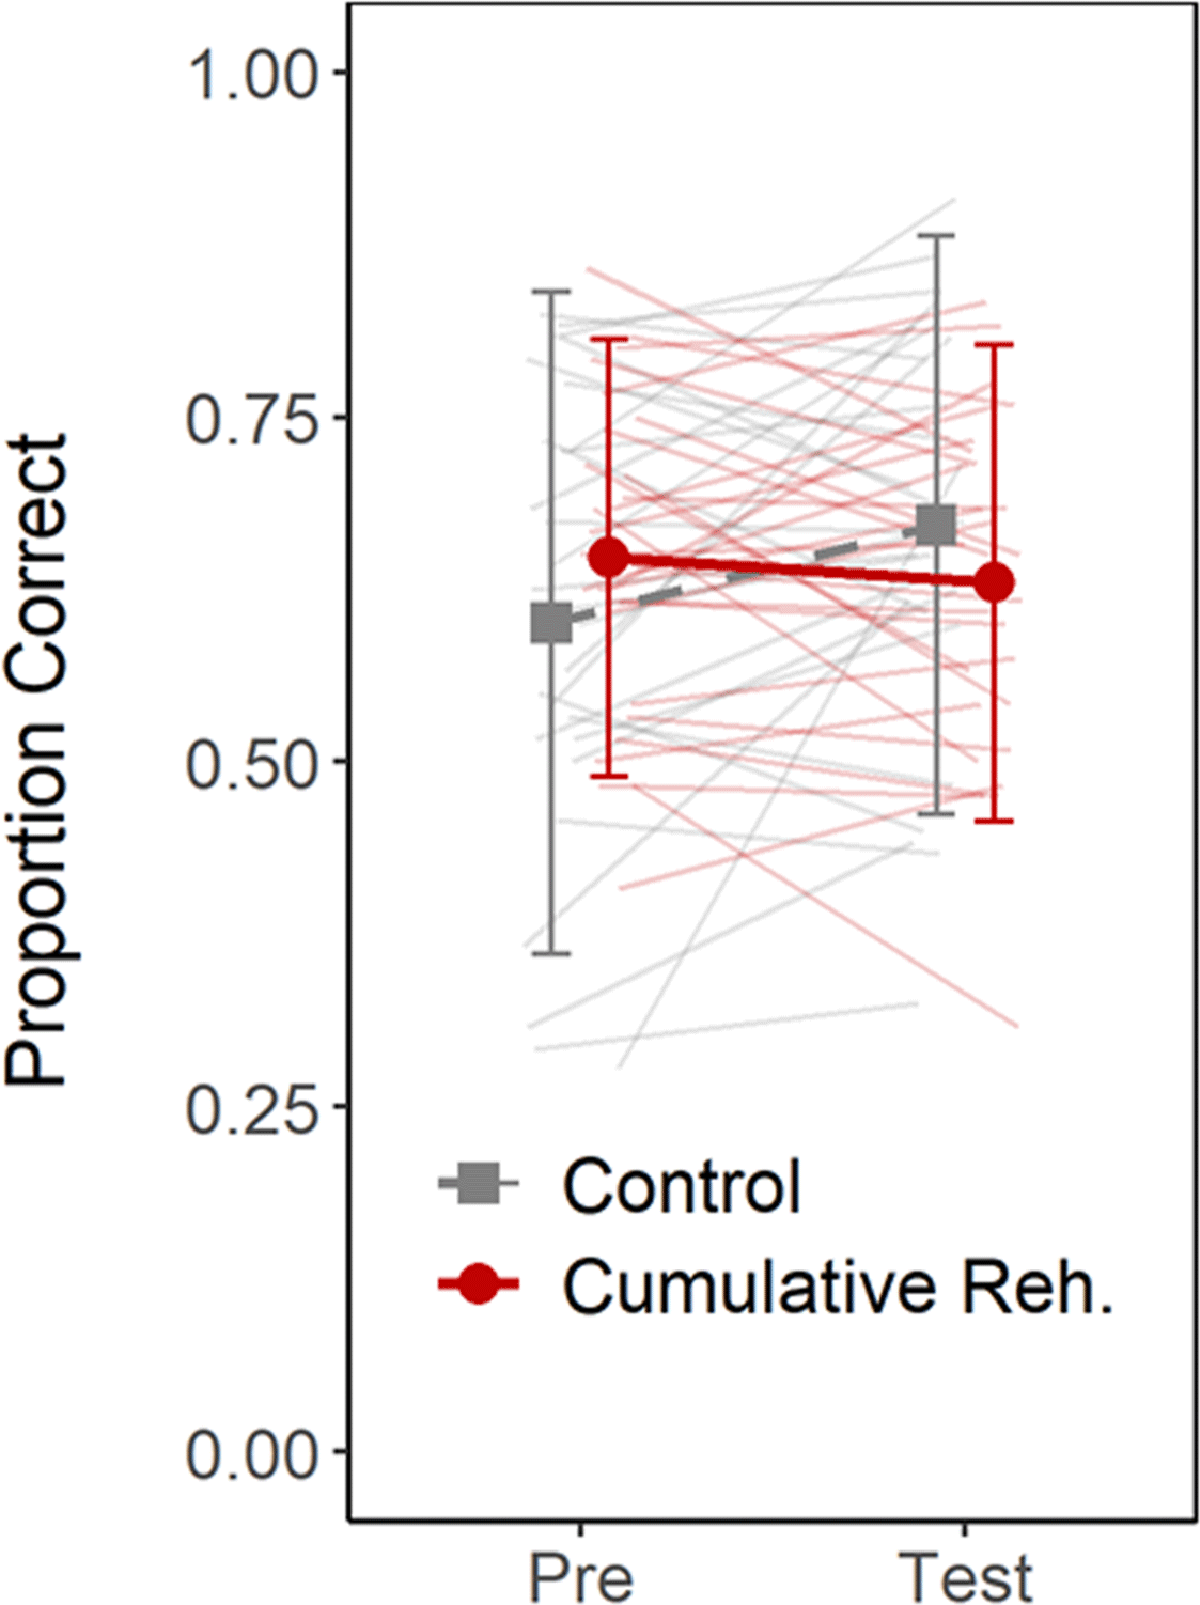
Figure 8
Overall proportion of correct responses in the complex span blocks (Pre-test vs. Test) in Experiment 2. Error-bars depict the standard deviation. The thin lines depict data of individual participants.
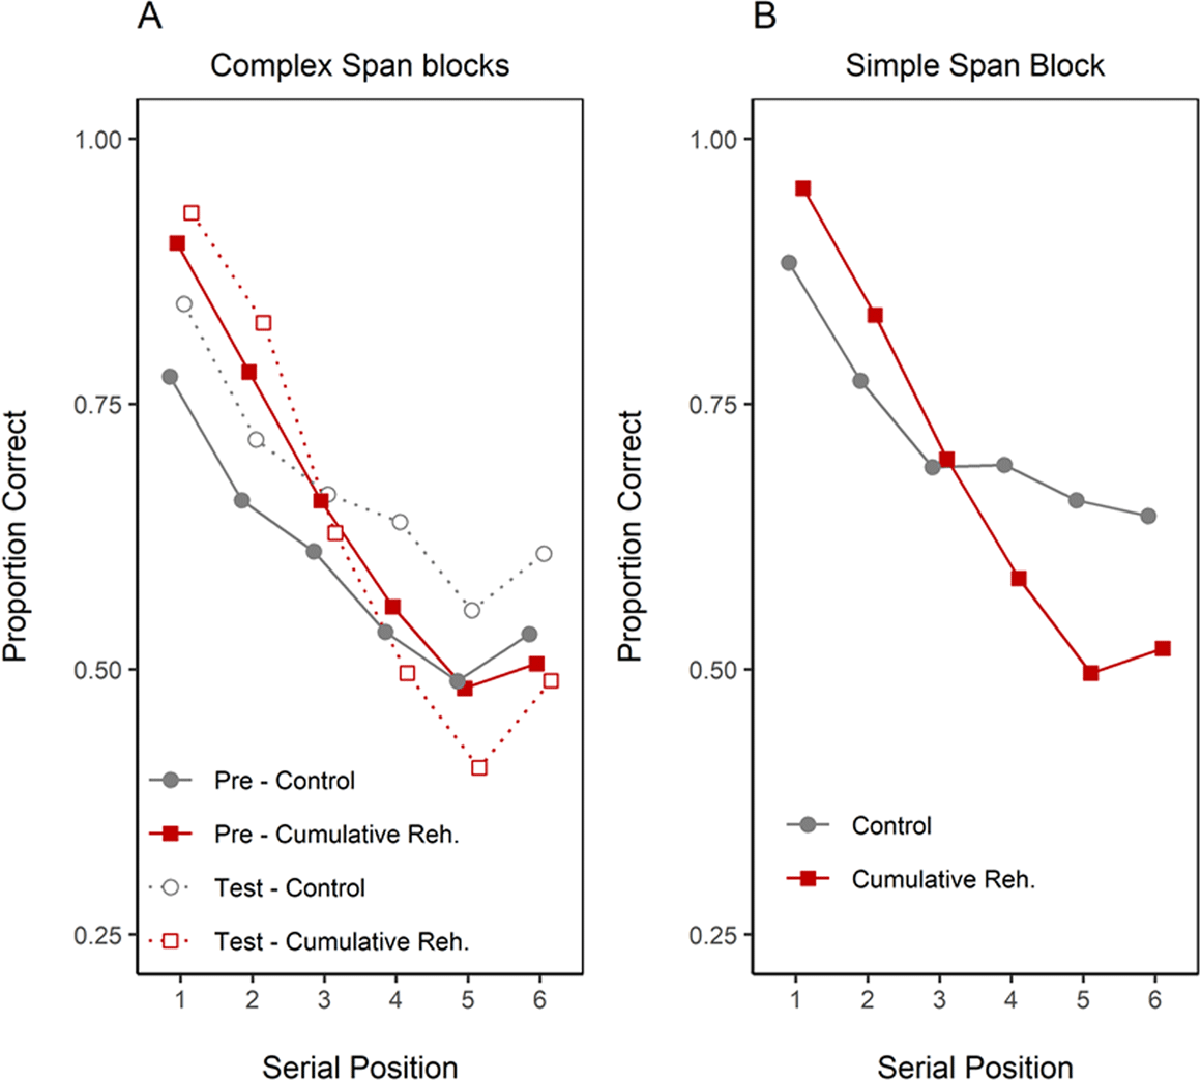
Figure 9
Serial position curves for the control and cumulative rehearsal groups in each block of Experiment 2. The task in Pre-test and Test blocks was complex span, and simple span in the Training block. In Training block the cumulative rehearsal group received the cumulative rehearsal instruction.
Table 6
Bayes Factors Quantifying the Strength of Evidence for the Main Effects and Interactions of the Variables Manipulated in Experiment 2.
| Term | BF10 |
|---|---|
| Group | 0.30 |
| Block | 0.57 |
| Serial Position | 1.12 × 1048 |
| Group × Serial Position | 19’664.2 |
| Block × Group | 5.74 |
| Block × Serial Position | 0.04 |
| Three-way interaction | 0.56 |
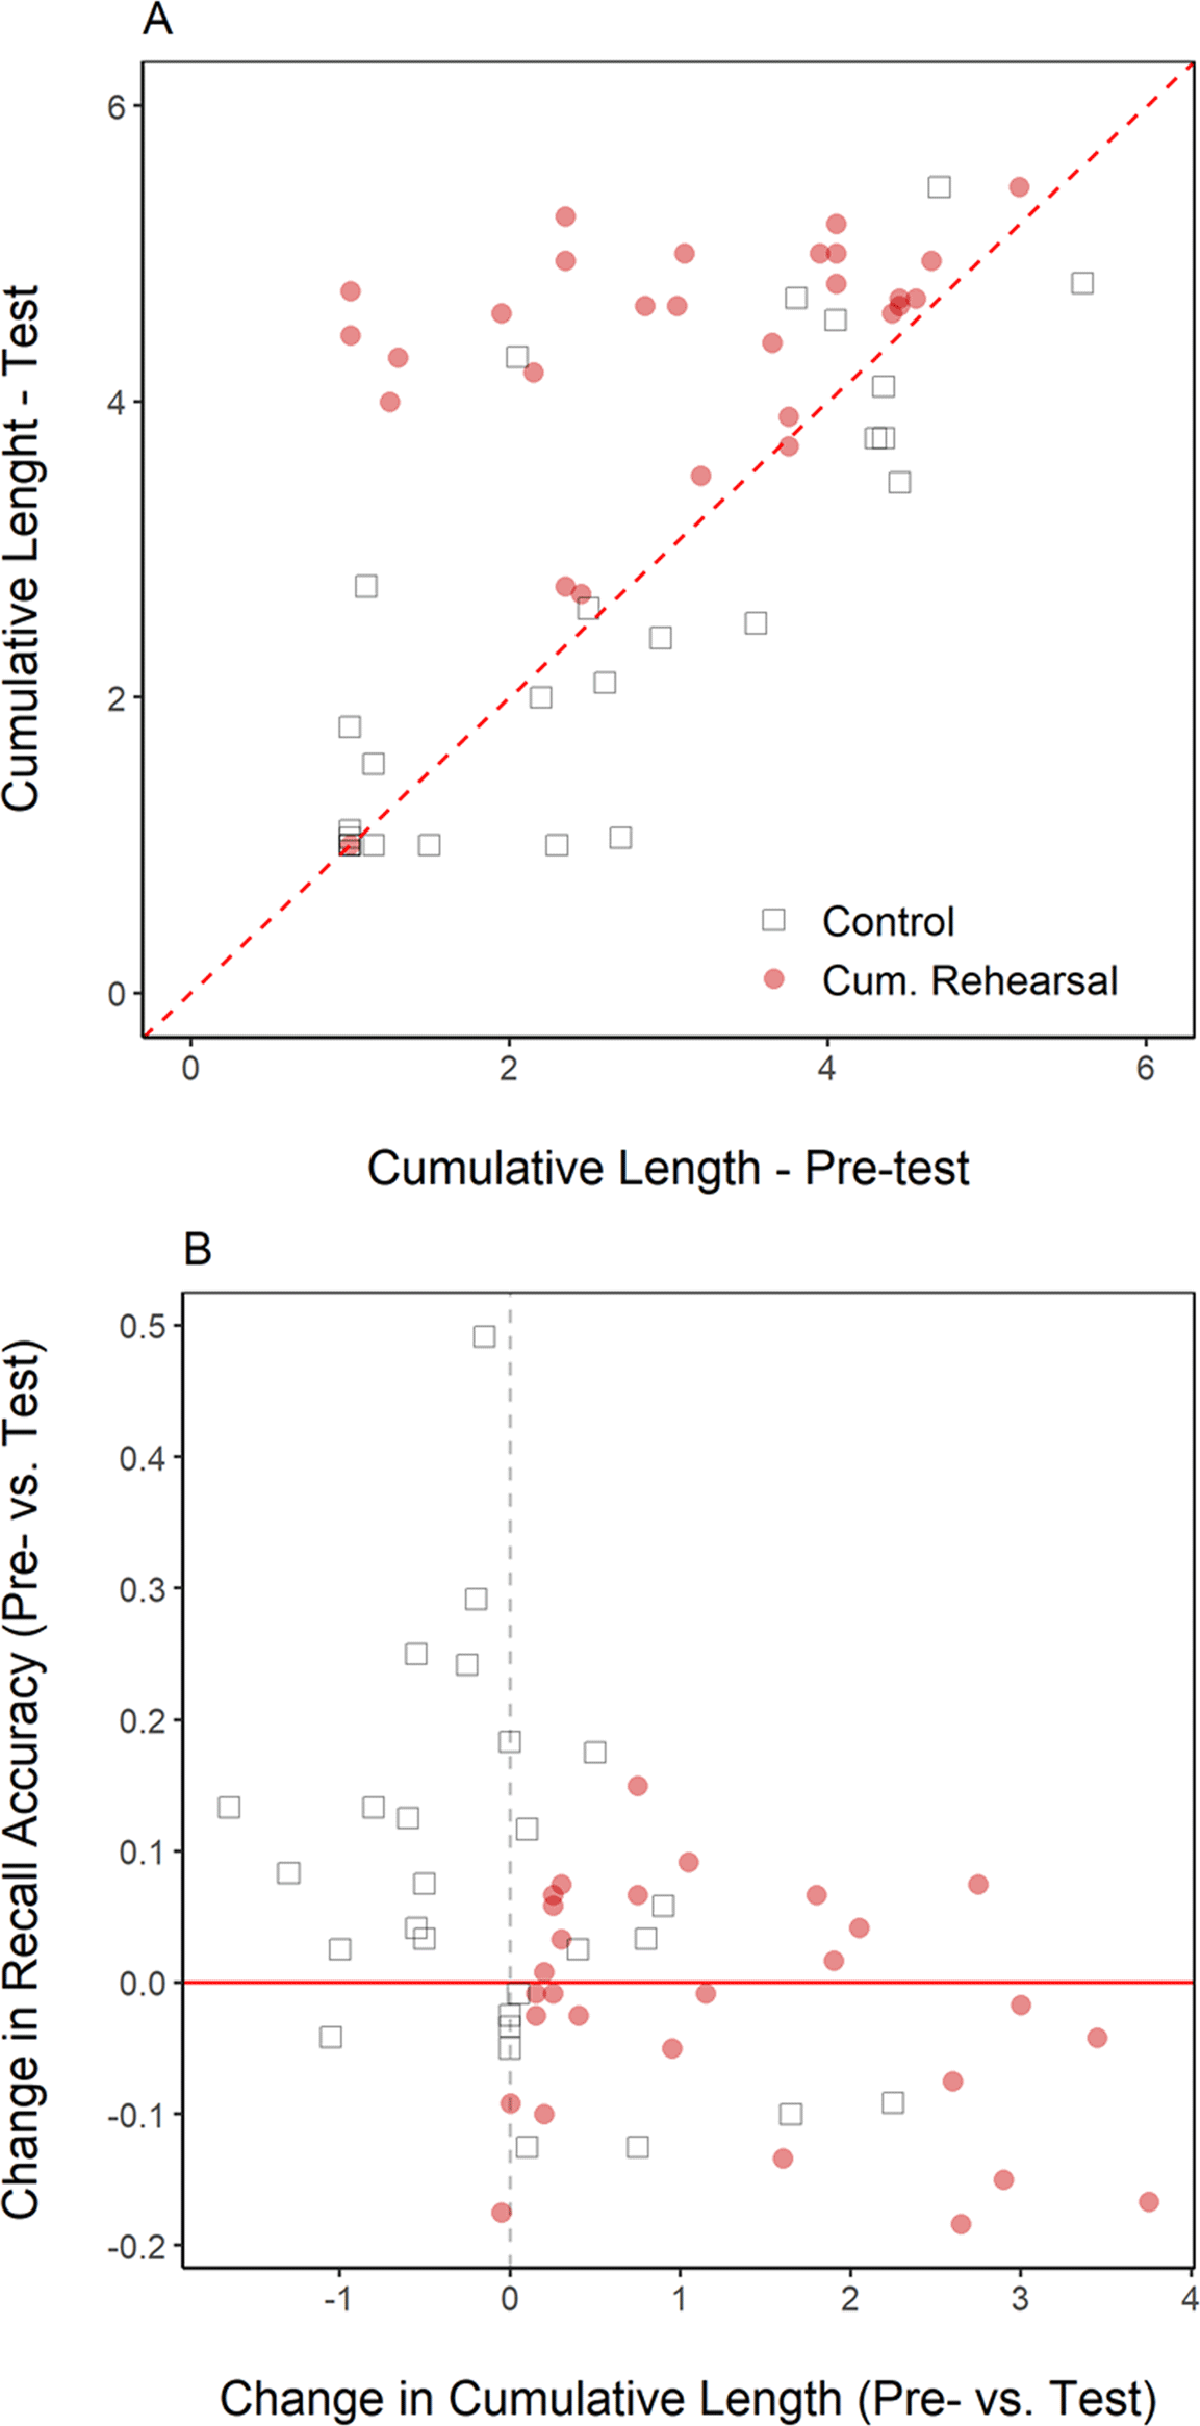
Figure 10
Panel A: average cumulative-rehearsal length in the Pre-test plotted against this measure in the Test block for each participant in Experiment 2. Values above the diagonal indicate an increase in the extent of cumulative rehearsal. Panel B: change in the extent of cumulative rehearsal between the Pre- and Test blocks against the change in recall accuracy between these blocks for each participant in Experiment 2.