
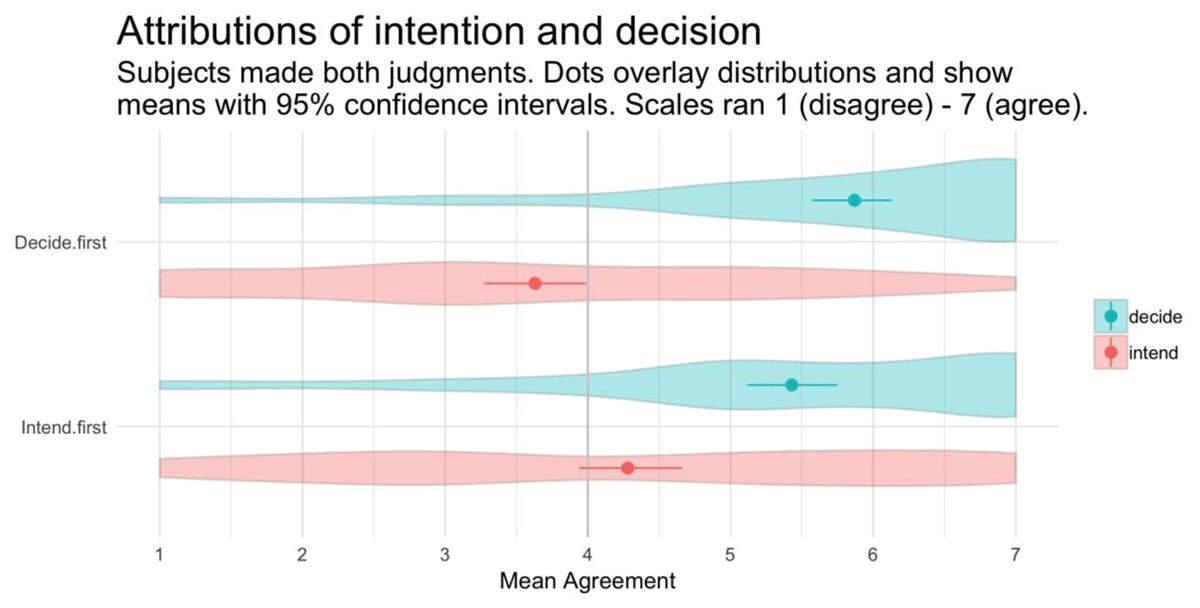
Figure 1
Experiment 1. Mean response overlaying distributions for decision and intent attributions (within-subjects) across two statement orders (between-subjects). Scales ran 1 (“disagree”)–7 (“agree”). Error bars show 95% bootstrapped confidence intervals.
Table 1
Experiment 1. Analysis of variance for the linear mixed model’s fixed effects.
| Sum of squares | Df1 | Df2 | F | p | |
|---|---|---|---|---|---|
| Order | 0.644 | 1 | 205 | 0.267 | .606 |
| Judgment | 299.107 | 1 | 207 | 124.092 | <.001 |
| Sex | 2.061 | 1 | 205 | 0.855 | .356 |
| Age | 0.001 | 1 | 205 | 0.000 | .985 |
| Order:Judgment | 31.164 | 1 | 207 | 12.929 | <.000 |
Table 2
Experiment 1. Paired samples t-tests for decision and intent attributions in the two order conditions.
| Order | estimate | 95 CI low | 95 CI high | df | t | p | d |
|---|---|---|---|---|---|---|---|
| Intend first | 1.147 | 0.738 | 1.556 | 108 | 5.555 | <.001 | 0.532 |
| Decide first | 2.240 | 1.796 | 2.684 | 99 | 10.005 | <.001 | 1.001 |
Table 3
Experiment 1. Descriptive statistics for decision and intent attributions in the two order conditions, along with the results of one sample t-tests against the neutral midpoint (test-value = 4).
| Order | Judgment | n | median | SD | mean | 95 CI low | 95 CI high | df | t | p | d |
|---|---|---|---|---|---|---|---|---|---|---|---|
| Intend first | intend | 109 | 5 | 2.01 | 4.28 | 3.90 | 4.66 | 108 | 1.47 | .14 | 0.14 |
| Intend first | decide | 109 | 6 | 1.65 | 5.43 | 5.09 | 5.75 | 108 | 9.04 | <.001 | 0.87 |
| Decide first | intend | 100 | 3 | 1.81 | 3.63 | 3.26 | 4.00 | 99 | –2.05 | .04 | –0.20 |
| Decide first | decide | 100 | 6 | 1.47 | 5.87 | 5.57 | 6.16 | 99 | 12.74 | <.001 | 1.27 |
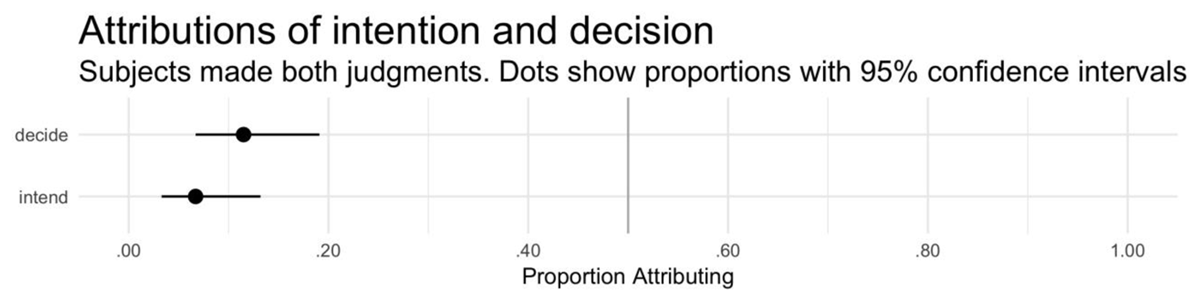
Figure 2
Experiment 2. Proportion of participants attributing intent and decision (within-subjects). Error bars show 95% bootstrapped confidence intervals.
Table 4
Experiment 2. Generalized linear model’s fixed effects.
| term | estimate | std. error | z | p |
|---|---|---|---|---|
| (Intercept) | –17.270 | 6.433 | –2.685 | .007 |
| Decide | 7.577 | 2.463 | 3.076 | .002 |
| Female | 0.148 | 2.716 | 0.054 | .957 |
| Age | –0.033 | 0.152 | –0.216 | .829 |
Table 5
Experiment 2. Descriptive statistics, binomial tests, and effect sizes for the two attributions.
| Judgment | n | k | prop | 95 CI low | 95 CI high | test value | p | h |
|---|---|---|---|---|---|---|---|---|
| intend | 104 | 7 | .067 | .033 | .132 | .5 | <.001 | –1.046 |
| decide | 104 | 12 | .115 | .067 | .191 | .5 | <.001 | –0.878 |
Table 6
Experiment 2. Counts of participants who made the four possible combinations of judgments (intent × decision: deny (= 0) or attribute (= 1)).
| Intend | Decide | Frequency |
|---|---|---|
| 0 | 0 | 91 |
| 1 | 0 | 1 |
| 0 | 1 | 6 |
| 1 | 1 | 6 |
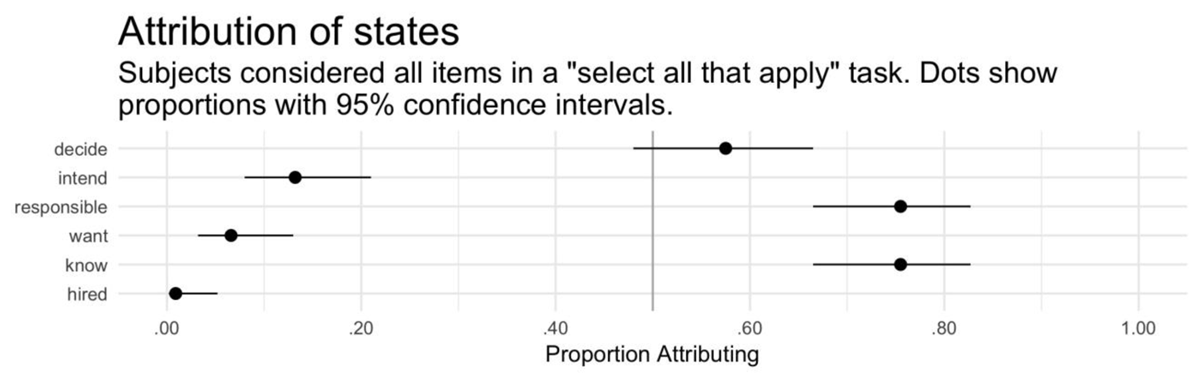
Figure 3
Experiment 3. Proportion of participants attributing intent and decision (within-subjects). Error bars show 95% bootstrapped confidence intervals.
Table 7
Experiment 3. Generalized linear model’s fixed effects.
| term | estimate | std. error | z | p.value |
|---|---|---|---|---|
| (Intercept) | –3.647 | 1.021 | –3.571 | <.001 |
| Decide | 2.895 | 0.630 | 4.598 | <.001 |
| Female | 0.341 | 0.466 | 0.730 | .465 |
| Age | 0.030 | 0.021 | 1.436 | .151 |
Table 8
Experiment 3. Descriptive statistics, binomial tests, and effect sizes for the test items.
| Judgment | n | k | prop | 95 CI low | 95 CI high | test value | p | h |
|---|---|---|---|---|---|---|---|---|
| decide | 106 | 61 | .575 | .480 | .665 | .5 | .145 | 0.152 |
| intend | 106 | 14 | .132 | .080 | .210 | .5 | <.001 | –0.827 |
| responsible | 106 | 80 | .755 | .665 | .827 | .5 | <.001 | 0.535 |
| want | 106 | 7 | .066 | .032 | .130 | .5 | <.001 | –1.051 |
| know | 106 | 80 | .755 | .665 | .827 | .5 | <.001 | 0.535 |
| hired | 106 | 1 | .009 | .002 | .052 | .5 | <.001 | –1.376 |
Table 9
Experiment 3. Counts of participants who made the four possible combinations of intent and decision: deny (= 0) or attribute (= 1).
| Intend | Decide | Frequency |
|---|---|---|
| 0 | 0 | 43 |
| 1 | 0 | 2 |
| 0 | 1 | 49 |
| 1 | 1 | 12 |
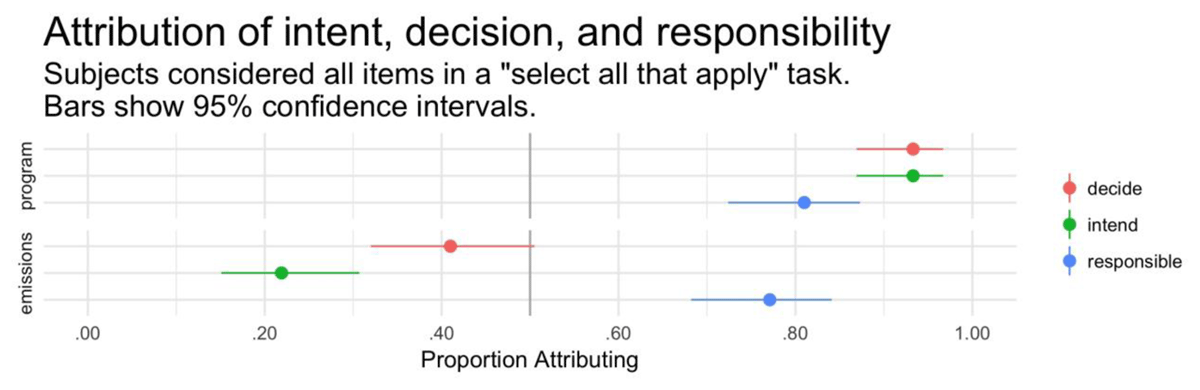
Figure 4
Experiment 4. Proportion of participants attributing intent, decision, and responsibility (within-subjects). Error bars show 95% bootstrapped confidence intervals.
Table 10
Experiment 4. Generalized linear model’s fixed effects.
| Term | estimate | std. error | z | p.value |
|---|---|---|---|---|
| (Intercept) | 2.006 | 0.593 | 3.382 | .001 |
| Decide | <.001 | 0.556 | 0.000 | 1 |
| Emissions | –4.043 | 0.523 | –7.735 | <.001 |
| Female | 0.097 | 0.296 | 0.329 | .742 |
| Age | 0.018 | 0.012 | 1.473 | .141 |
| Decide:Emissions | 0.942 | 0.642 | 1.466 | .143 |
Table 11
Experiment 4. Descriptive statistics, binomial tests, and effect sizes for the test items.
| Judgment | Focus | n | k | prop | 95 CI low | 95 CI high | test value | p | h |
|---|---|---|---|---|---|---|---|---|---|
| decide | program | 105 | 98 | .933 | .869 | .967 | .5 | <.001 | 1.048 |
| decide | emissions | 105 | 43 | .410 | .320 | .505 | .5 | .078 | –0.182 |
| intend | program | 105 | 98 | .933 | .869 | .967 | .5 | <.001 | 1.048 |
| intend | emissions | 105 | 23 | .219 | .151 | .307 | .5 | <.001 | –0.597 |
| responsible | program | 105 | 85 | .810 | .724 | .873 | .5 | <.001 | 0.668 |
| responsible | emissions | 105 | 81 | .771 | .682 | .841 | .5 | <.001 | 0.574 |
Table 12
Experiment 4. Counts of participants who made the four possible combinations of intent and decision: deny (= 0) or attribute (= 1).
| Intend | Decide | Frequency |
|---|---|---|
| 0 | 0 | 58 |
| 1 | 0 | 4 |
| 0 | 1 | 24 |
| 1 | 1 | 19 |
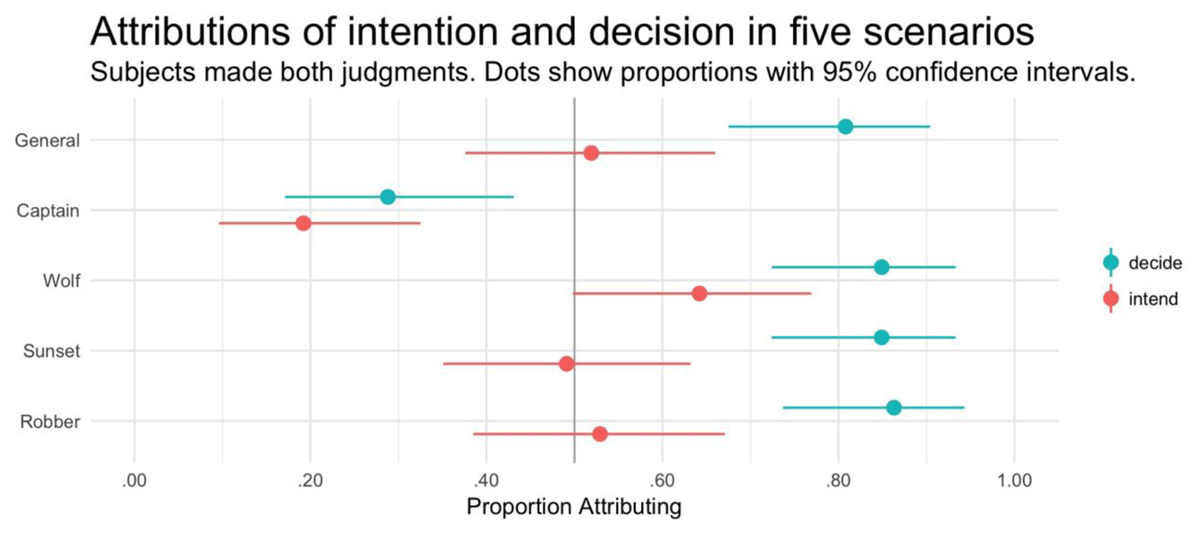
Figure 5
Experiment 5. Proportion of participants attributing intent, decision, and responsibility (within-subjects). Error bars show 95% bootstrapped confidence intervals.
Table 13
Experiment 5. Generalized linear mixed model’s fixed effects.
| Term | estimate | std. error | z | p |
|---|---|---|---|---|
| (Intercept) | –0.793 | 0.685 | –1.158 | .247 |
| Decide | 1.683 | 0.281 | 5.989 | <.001 |
| Female | 0.221 | 0.280 | 0.791 | .429 |
| Age | 0.013 | 0.012 | 1.024 | .306 |
Table 14
Experiment 5. Descriptive statistics, binomial tests, and effect sizes for the test items across all conditions.
| Condition | Judgment | n | k | prop | conf.low | conf.high | test.prop | p | h |
|---|---|---|---|---|---|---|---|---|---|
| General | intend | 52 | 27 | .519 | .376 | .660 | .5 | .890 | 0.038 |
| General | decide | 52 | 42 | .808 | .675 | .904 | .5 | <.001 | 0.663 |
| Captain | intend | 52 | 10 | .192 | .096 | .325 | .5 | <.001 | –0.663 |
| Captain | decide | 52 | 15 | .288 | .171 | .431 | .5 | .003 | –0.437 |
| Wolf | intend | 53 | 34 | .642 | .498 | .769 | .5 | .053 | 0.287 |
| Wolf | decide | 53 | 45 | .849 | .724 | .933 | .5 | <.001 | 0.773 |
| Sunset | intend | 53 | 26 | .491 | .351 | .632 | .5 | 1 | –0.019 |
| Sunset | decide | 53 | 45 | .849 | .724 | .933 | .5 | <.001 | 0.773 |
| Robber | intend | 51 | 27 | .529 | .385 | .671 | .5 | .780 | 0.059 |
| Robber | decide | 51 | 44 | .863 | .737 | .943 | .5 | <.001 | 0.812 |