
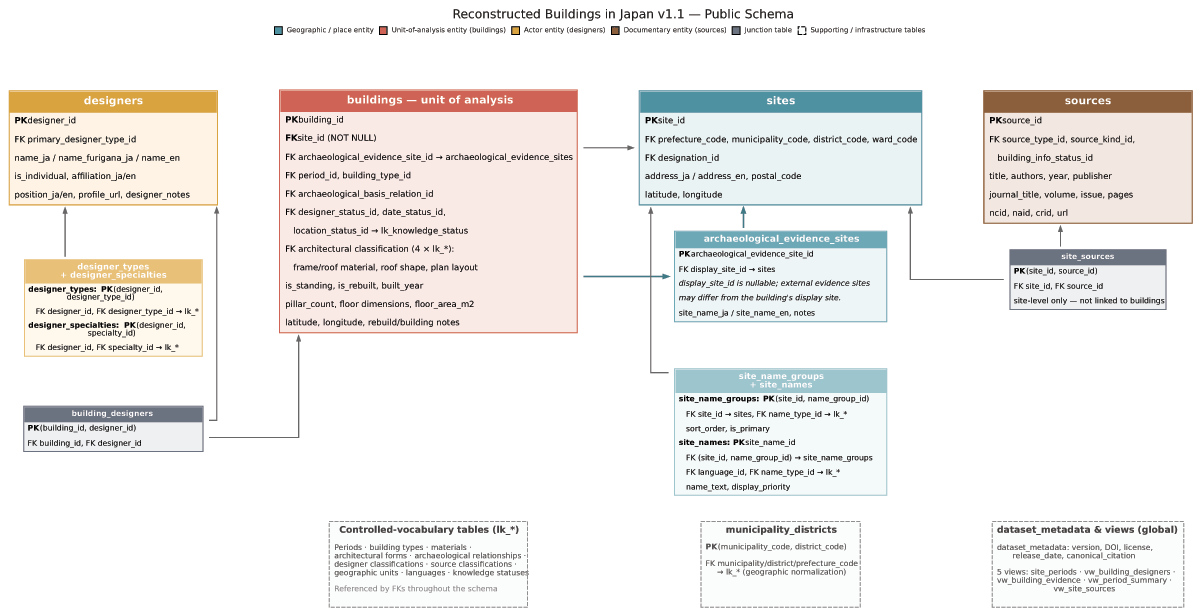
Figure 1
Entity-relationship diagram of the public dataset. Principal entities are reconstructed buildings, sites, designers, and documentary sources, with supporting tables for archaeological evidence, names, geography, and controlled vocabularies.
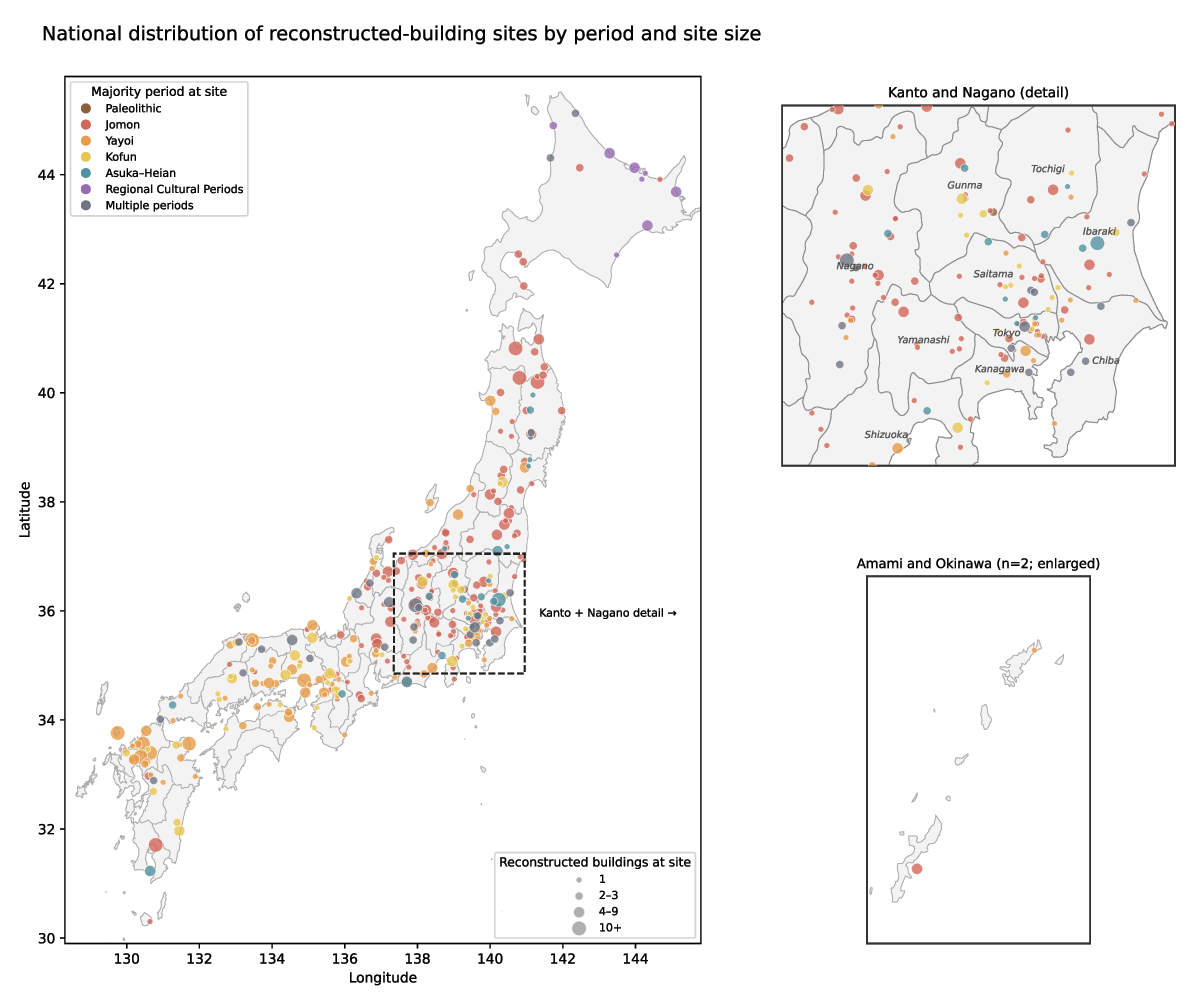
Figure 2
National distribution of reconstructed-building sites by archaeological period and site size. Symbol colour indicates the majority archaeological period group at each site, and symbol size indicates the number of reconstructed buildings. Insets show Kanto and Nagano, and Amami and Okinawa.