
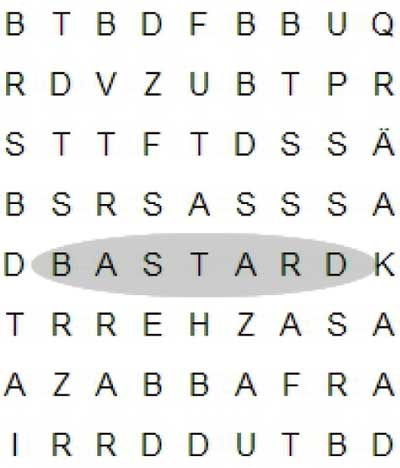
Figure 1
An example of the Word-Grid as presented to the participants in the second task. In the experiment the word had not been highlighted and had to be found within the set of distractors.
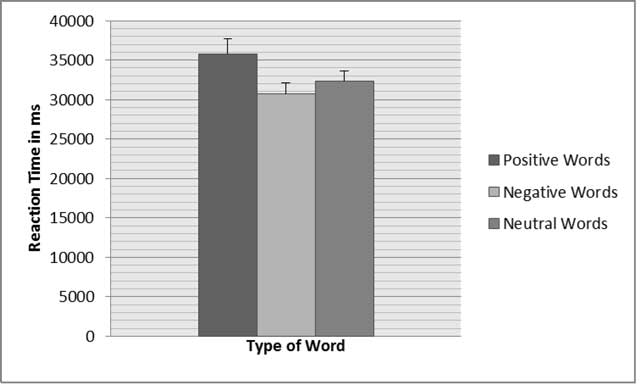
Figure 2
Mean RTs for neutral, positive, and high-arousal negative words. Error bars represent 1 SE.
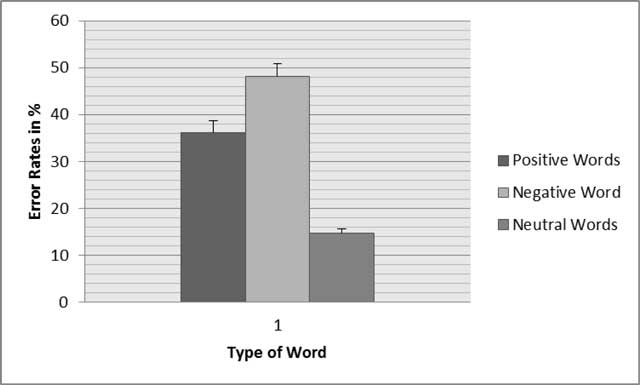
Figure 3
Error rate in percent for neutral, positive, and high-arousal negative words. Error bars represent 1 SE.