
Table 1
PCL-C scores among the soldiers measured before deployment, at homecoming and 2.5 years after homecoming (n = 445).
| Before deployment (December 2008 – January 2009) | At homecoming (August 2009) | 2.5 years after homecoming (March 2012 – October 2012) | |
|---|---|---|---|
| Soldiers with PCL-C score 17–29 | 393 (88.3%) | 403 (90.6%) | 330 (74.2%) |
| Soldiers with PCL-C score 30–43 | 39 (8.8%) | 34 (7.6%) | 74 (16.6%) |
| Soldiers with PCL-C score >44 | 13 (2.9%) | 8 (1.8%) | 41 (9.2%) |
[i] Note. Soldiers with PCL-C score 17–29 are characterized by none or few PTSD symptoms, soldiers with PCL-C score 30–43 are characterized by some PTSD symptoms and soldiers with PCL-C score > 44 are characterized by intense PTSD symptoms corresponding to a PTSD diagnosis (Blanchard et al., 1996).
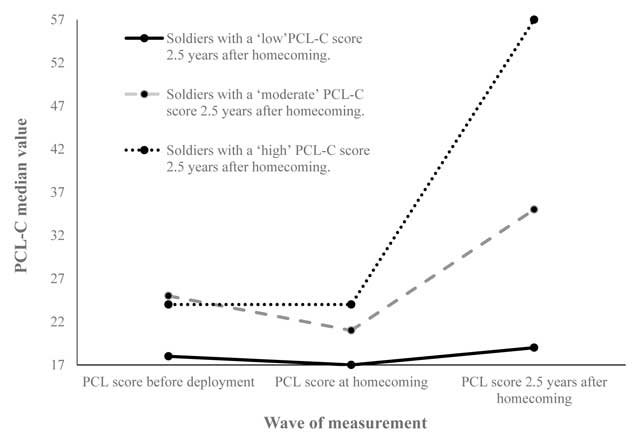
Figure 1
The development in PCL-C scores for the three groups of soldiers with a ‘low’, ‘moderate’ and ‘high’ PCL-C score 2.5 years after homecoming.
Table 2
Test for differences in PCL scores among male soldiers 2.5 years after homecoming between the five domains of the NEO FFI.
| N = 432 | Spearman’s rho correlation coefficient | p-value |
|---|---|---|
| Neuroticism | .290*** | < .001 |
| Extraversion | -.037 | .449 |
| Agreeableness | -.184** | < .001 |
| Conscientiousness | -.117 | .160 |
| Openness to Experience | .059 | .222 |
[i] Note. ** p < .01; *** p < .001.
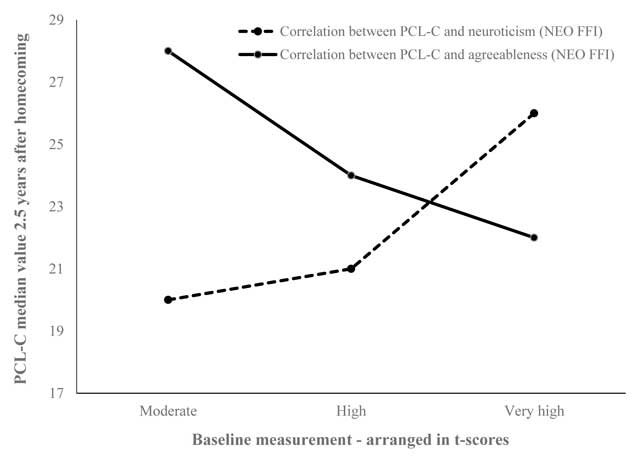
Figure 2
Correlation between PCL-C 2.5 years after homecoming and the personality traits of neuroticism and agreeableness measured before deployment (NEO FFI).
Table 3
Test for other risk factors with correlation to the development of PTSD symptoms 2.5 years after homecoming (tests performed on the ungrouped PCL-C).
| N | Spearman’s rho correlation coefficient | Spearman’s rho p-value | |
|---|---|---|---|
| Measurements before deployment | |||
| Age in years | 427 | -.125** | .010 |
| Educational status (with or without lower secondary school leaving examination) | 424 | -.157*** | < .001 |
| Terms of employment (short term or permanent employment) | 424 | -.099* | .042 |
| Years employed in the Danish Defence | 379 | .081 | .121 |
| Previously deployed to international duty (yes/no) | 423 | .051 | .089 |
| Combat soldier-status (yes/no) | 426 | .115* | .017 |
| Traumatic events (TLEQ) | 370 | .248*** | < .001 |
| Physical punishment during childhood (5 options from ‘never’ to ‘more than 5 times’ | 380 | .156** | .002 |
| Witnessing violence during childhood (5 options from ‘never’ to ‘more than 5 times’ | 379 | .189*** | < .001 |
| Nonconsensual sexual relations during childhood (5 options from ‘never’ to ‘more than 5 times’ | 380 | .048 | .172 |
| Social support (MPSSS) | 358 | .079 | .114 |
| Depression score (BDI II) | 372 | .068 | .253 |
| PTSD symptom score (PCL-C) | 423 | .235*** | < .001 |
| Received help from psychologist/psychiatrist before deployment (yes/no) | 378 | .225*** | < .001 |
| Measurement at homecoming (including subjective assessment of mission-related stressors) | |||
| Combat exposure (CES) | 320 | .014 | .441 |
| Hurt or injured during deployment (yes/no) | 339 | .056 | .783 |
| Subjective appraisal of exposure to injury during deployment (five options from ‘very low’ to ‘very high’ probability) | 338 | .080 | .144 |
| Subjective appraisal of general risk during deployment (5 options from ‘low’ to ‘high’ risk) | 336 | .088 | .109 |
| Number of experienced situations with emotional strain during deployment (‘never’ to ‘often’) | 338 | .079 | .114 |
| Subjective appraisal of life danger for oneself or others during deployment (yes/no) | 334 | .379 | .125 |
| Killed one or more enemies (5 options from ‘never’ to ‘51 or more’) | 328 | .176*** | < .001 |
| Social support (MPSSS) | 336 | .076 | .097 |
| Never felt attached to another person (5 options ranging from ‘totally disagree’ to ‘absolutely agree’) | 343 | .155** | .004 |
| Feeling lonely (5 options ranging from ‘not at all’ to ‘very much’) | 344 | .166** | .002 |
| Measurements 2.5 years after homecoming | |||
| Traumatic events after homecoming (TLEQ) | 423 | .180*** | < .001 |
| Deployment since homecoming (yes/no). | 423 | .089 | .118 |
| Social support (MPSSS) | 424 | .186*** | < .001 |
[i] Note. * p ≤ .5, ** p ≤ .01, *** p ≤ .001; Sample sizes differ due to a varying number of soldiers responding on the different questionnaires. Furthermore as described in the method section, the response rate decreased considerably at homecoming.